- ETH price started a solid upward move and traded above the $138 resistance against the US Dollar.
- The price tested the $140 resistance and it seems like there could be more gains.
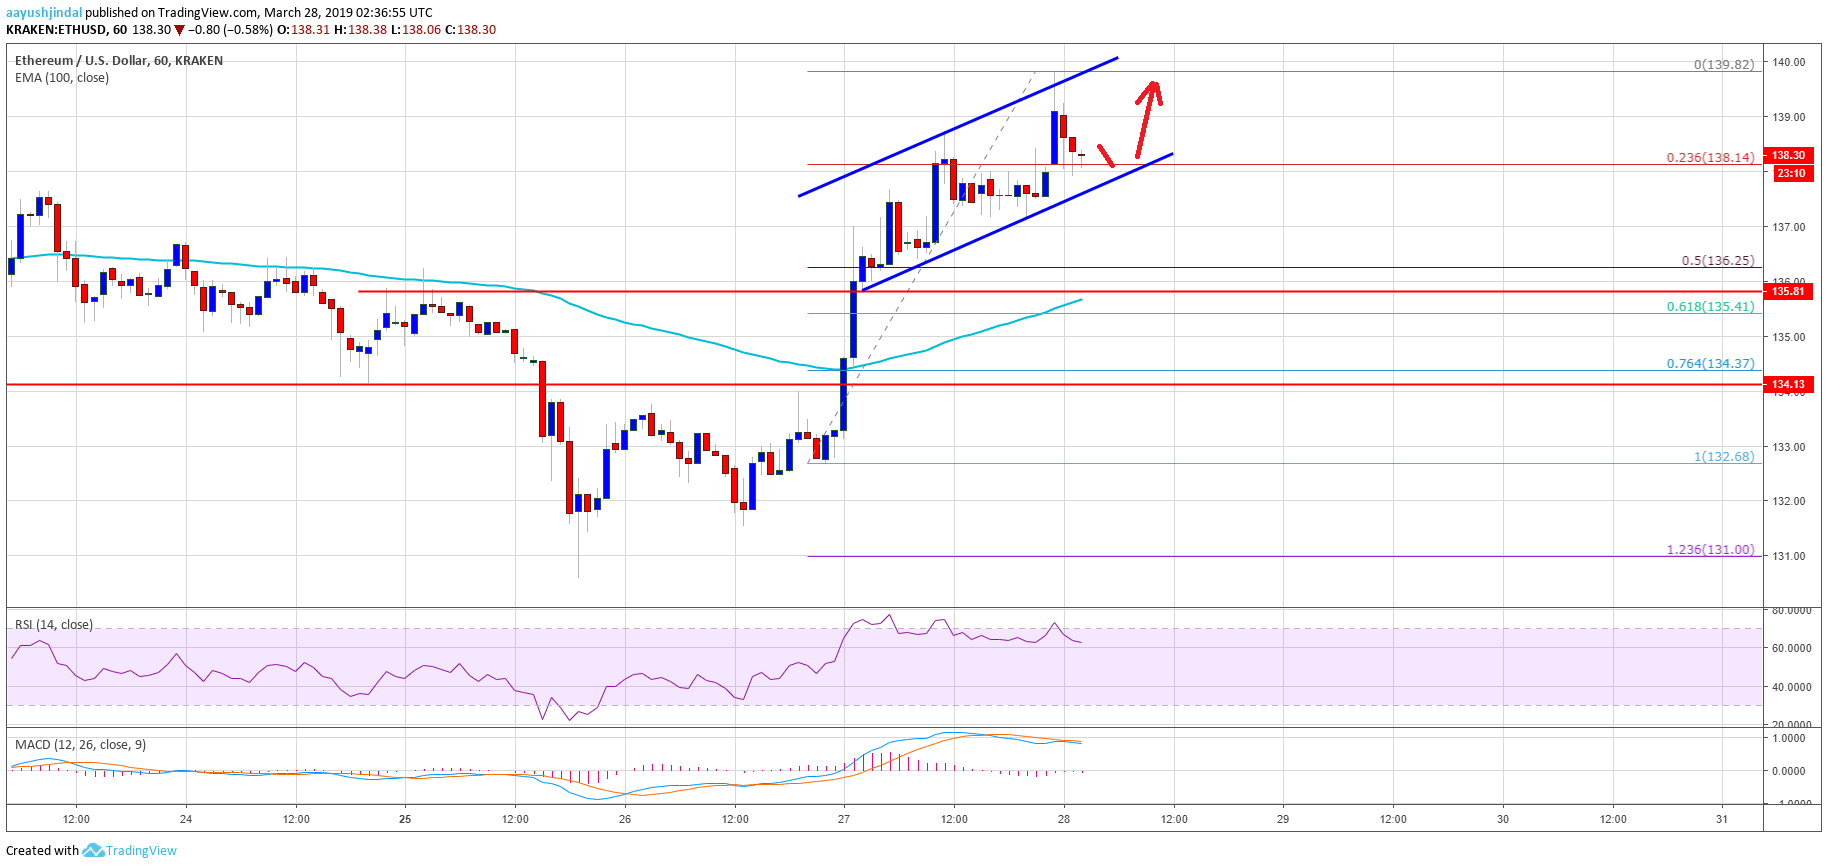
- There is an ascending channel in place with support at $138 on the hourly chart of ETH/USD (data feed via Kraken).
- The pair is likely to accelerate higher once there is a clear break above the $140 resistance level.
price is following a convincing bullish path against the US Dollar and . ETH is likely to pump above the $140 resistance area in the coming sessions.
Ethereum Price Analysis
After a major drop, ETH price found support near the $130 area against the US Dollar. The ETH/USD pair started a solid recovery and broke the $134 and $135 resistance levels. Later, there was a close above the $135 barrier and the 100 hourly simple moving average. There were slow and steady gains above the $137 and $138 levels. The price even traded above the $139 level recently and tested the $140 resistance level. A swing high was formed near $140 and the price is currently consolidating gains.
An initial support is near the $138 level. It coincides with the 23.6% Fib retracement level of the recent wave from the $133 swing low to $140 high. There is also an ascending channel in place with support at $138 on the hourly chart of ETH/USD. Therefore, the price is likely to follow a as long as it is above the $138 support. If there is a downside break below the channel support, the price may test the $136 support area.
The 50% Fib retracement level of the recent wave from the $133 swing low to $140 high is also near the $136 level. Finally, the next support is near the $135 level and the 100 hourly simple moving average. On the upside, an initial resistance is near the $140 level, representing a crucial barrier for buyers. If there is an upside break above the $140 resistance, there could be heavy gains in the coming sessions.
Looking at the , ETH price seems to be following a nice uptrend above the $138 and $136 support levels. Once there is a break above the $140 barrier, the price is likely to test the $144-145 resistance area. On the downside, if there is a break below the $138 support, buyers are likely to take a stand near the $136 level.
ETH Technical Indicators
Hourly MACD – The MACD for ETH/USD is about to move back in the bullish zone.
Hourly RSI – The RSI for ETH/USD is currently correcting lower from the 70 level.
Major Support Level – $136
Major Resistance Level – $140
Published at Thu, 28 Mar 2019 04:34:01 +0000