October 9, 2026

Capitalizations Index – B ∞/21M

Ethereum Price Analysis: ETH Breaks Down, Turned Sell on Rallies

Ethereum price analysis: eth breaks down, turned sell on rallies

Ethereum Price Analysis: ETH Breaks Down, Turned Sell on Rallies

  • ETH price traded below the $114 and $112 supports levels to move into a bearish zone against the US Dollar.
  • There is a major bearish trend line formed with resistance at $112 on the hourly chart of ETH/USD (data feed via Kraken).
  • The pair may correct higher a few points, but it likely to face sellers near the $112 or $114 level.

Ethereum price made a sharp bearish turn against the US Dollar and bitcoin. ETH/USD is now trading in a bearish zone and it could continue to move down towards $104.

Ethereum Price Analysis

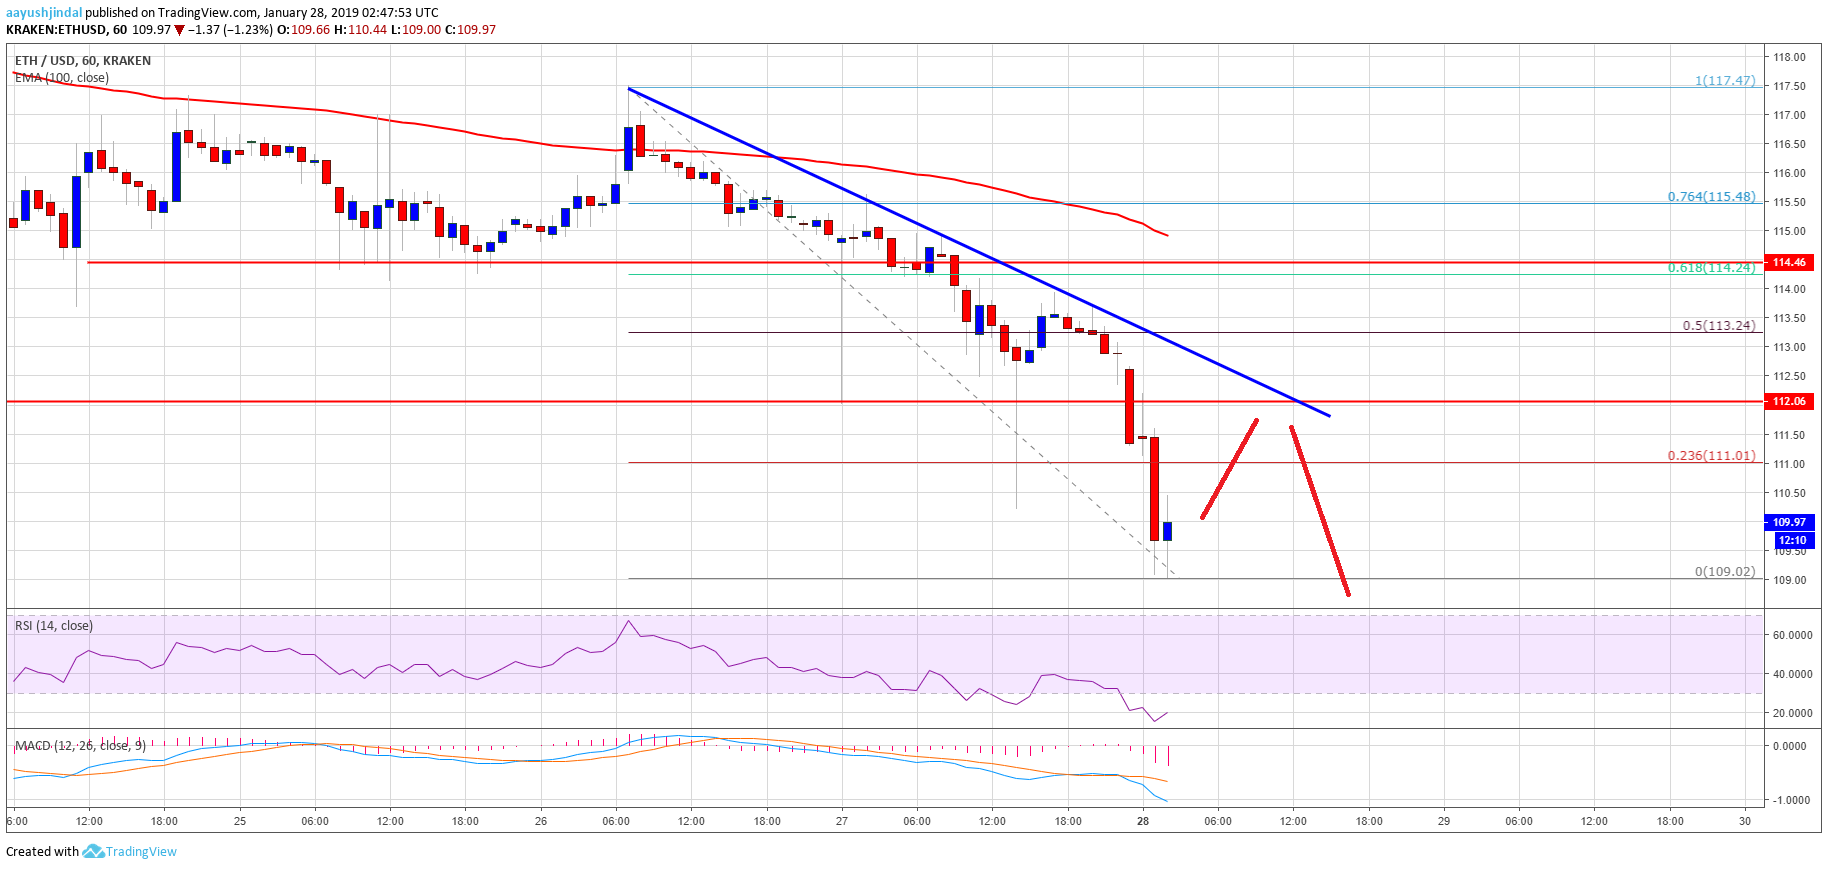
In the weekly analysis, we discussed the next possible break in ETH price either above $120 or below $114 against the US Dollar. The ETH/USD pair failed to gain momentum above the $116 and $118 resistance levels. As a result, there was a bearish reaction below the $114 support. The pair even broke the $112 support and traded well below the 100 hourly simple moving average. The decline was such that the price even traded below the $110 level and formed a new low near $109.

At the moment, the price is consolidating losses near $110, with a bearish angle. An initial resistance is near the 23.6% Fib retracement level of the recent decline from the $117 high to $109 low. More importantly, there is a major bearish trend line formed with resistance at $112 on the hourly chart of ETH/USD. It won’t be easy for buyers to clear the trend line resistance and $112. The next hurdle is near the $113 level. It coincides with the 50% Fib retracement level of the recent decline from the $117 high to $109 low.
Ethereum price analysis eth chart

Looking at the chart, ETH price is clearly trading in a bearish zone below the $114 and $112 levels. If there is an upside correction, the price is likely to face a lot of sellers near $112, $113 and $114.

ETH Technical Indicators

Hourly MACD – The MACD for ETH/USD is now placed heavily in the bearish zone.

Hourly RSI – The RSI for ETH/USD is currently placed in the oversold area, but with no major sign of a recovery.

Major Support Level – $104

Major Resistance Level – $112

Published at Mon, 28 Jan 2019 04:08:52 +0000

Previous Article

Will Reinterpreted Gambling Laws Affect EOS & TRON DApps?

Next Article

Realblocks Closes $3.1 Million Seed Round, Morgan Creek Digital among Backers

You might be interested in …

Ether Price Analysis: Bullish Momentum Seems to Be Waning

Ether Price Analysis

Early in the summer, the entire crypto market took a sustained, downward move that left ETH-USD dropping in value by approximately 60 percent. At the start of the bear market, the price of ether was $360 and ultimately found lows bottoming out in the $130s. As of today, ETH-USD market price is in the mid $330s, and the volume shows no signs of new investment interest:

Figure_1 (2).JPGFigure 1: ETH-USD, 12-Hour Candles, Bitfinex, Bear Market Fibonacci Retracement Values

Although the high of the market was in the upper $400s, my personal opinion is that it’s best to view the market beginning within the $360 values. This price range represents the market acceptance of the impending bear market. Currently, ether is pushing new local highs on decreasing volume. Leading into this push, ETH-USD spent a couple weeks consolidating around the $300 range before ultimately breaking out to $340.

Let’s first take a look at the macro trend market indicators and then zoom in to the smaller timescales:

Figure_2 (2).JPGFigure 2: ETH-USD, 6-Hour Candles, Bitfinex, Current Bull Run

Three major indications of bullish exhaustion are visible in the $300 values:

  1. Price growth on decreasing volume

  2. MACD divergence

  3. RSI divergence

The market is currently struggling to make new highs, and the classic signs of bullish momentum loss are seen quite clearly on the RSI and MACD.

Zooming in to the 1-hour candle trend, we see further signs of bullish exhaustion:

Figure_3 (2).JPGFigure 3: ETH-USD, 1-Hour Candles, Bitfinex, Micro Trend

The MACD and RSI momentum divergence is visible within a bearish pattern known as an “Ascending Wedge.” Currently, the market is attempting to break to the bottom of the wedge and shows moderate signs of sell volume increasing upon the breakout point. A sustained breakdown of this pattern would give an approximate price target of the low $300 values.

To understand whether the downward move is a sustained move or merely a support test, we will have to observe the volume trend in correlation with price movement. Sustained volume growth within a downward move indicates less confidence in higher values, and higher interest in the lower values.

A sustained move on the micro trend could lead to a test of a potential macro trend on the high timescales. Similar to the 1-hour candle trend, the 4-hour candle trend also shows an Ascending Wedge:

Figure_4 (1).JPGFigure 4: ETH-USD, 4-Hour Candles, Bitfinex, Macro Ascending Wedge

A breakdown of this rising wedge could have a significant price target in the $250–260 range. Again, when confirming the macro trend breakdown, it is a good idea to watch the volume to confirm a trend and reduce the risk of a market fakeout.

Whether the market is interested in a sustained move to lower values remains to be seen. However, a couple things are very clear: the overall market volume is decreasing with every push to higher values, and the RSI and MACD on both macro and micro scales are showing bullish momentum loss.

Summary:

  1. Bullish momentum loss is visible across both the micro and macro trends.

  2. Currently, the ETH-USD 1-hour candle trend is testing the lower boundary of a rising wedge and has yet to have a confirmed breakdown of the pattern.

  3. A breakdown in price in the current market could lead to a sustained bearish market on the macro scale.

Trading and investing in digital assets like bitcoin, bitcoin cash and ether is highly speculative and comes with many risks. This analysis is for informational purposes and should not be considered investment advice. Statements and financial information on bitcoin Magazine and BTC Media related sites do not necessarily reflect the opinion of BTC Media and should not be construed as an endorsement or recommendation to buy, sell or hold. Past performance is not necessarily indicative of future results.

The post Ether Price Analysis: Bullish Momentum Seems to Be Waning appeared first on Bitcoin Magazine.

Space audisee w/ djuma soundsystem

Space Audisee w/ Djuma Soundsystem

Space Audisee w/ Djuma Soundsystem ATTN: HNL SEEKING ASTRONAUTS FOR DEEP SPACE EXPLORATION. Mission Overview: Pilot: DJUMA SOUNDSYSTEM CoPilots: MONIKER, FATHOMVehicle: ONG KING ARTS CENTERLaunch Pad: 1154 FORT ST. MALL Launch Time: 9PM , 4/13Required equipment: SPACE ATTIRE, FLOW TOYSMission […]