The views and opinions expressed here are solely those of the author and do not necessarily reflect the views of Cointelegraph.com. Every investment and trading move involves risk, you should conduct your own research when making a decision.
The market data is provided by the exchange.
Global Equity Markets: Mixed performance
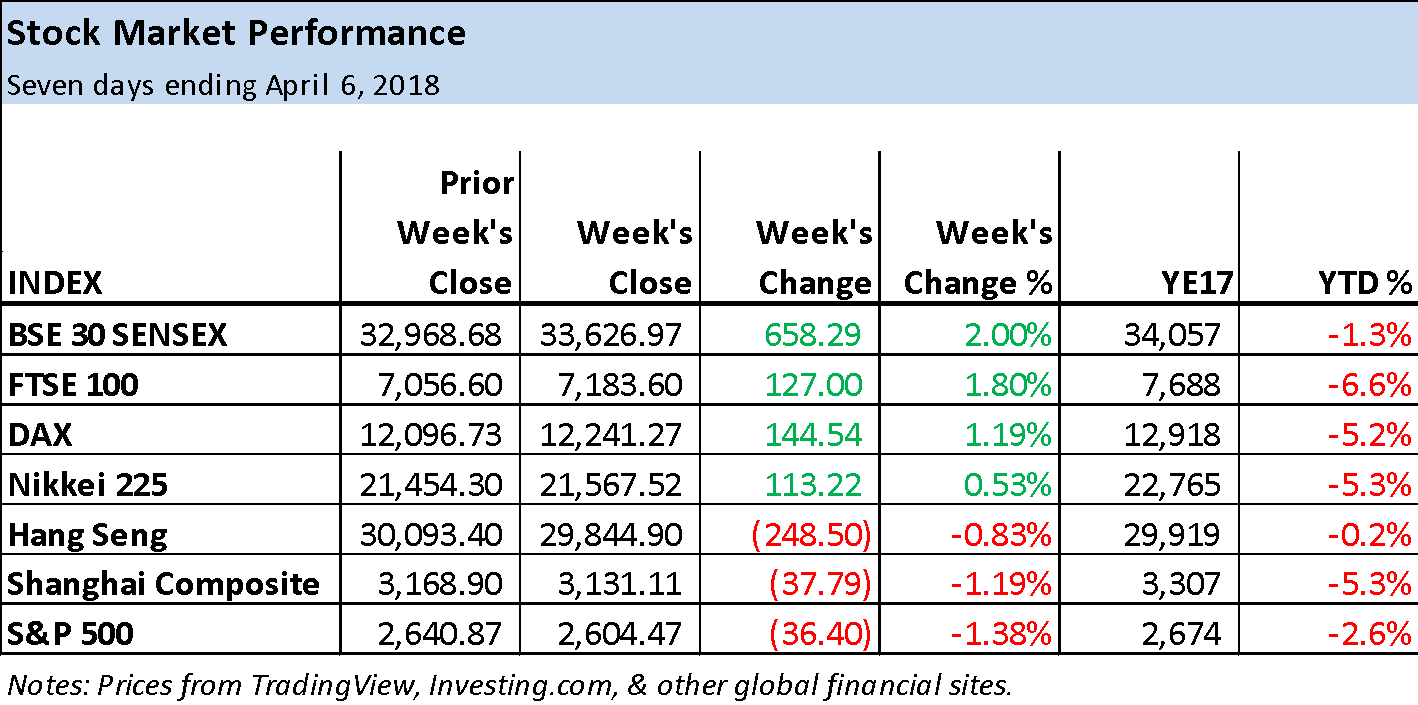
Global equity markets ended mixed last week, ranging from a 2.0% gain for India’s to a 1.4% loss for the . Trade war fears have put weight on equities as the conflict between China and the US appeared to intensify with US President Donald Trump threatening against China on Thursday.
This followed China’s announcement of on over 100 US products on Wednesday. Adding to investors’ concerns is the fact that this conflict is occurring against the backdrop of a trend towards . Needless to say, it’s not clear how this might end and markets are rightly nervous.
On a technical basis, little progress has been made over the past eight weeks or so in most major equity markets. Indices continue to test support following selloffs from reached in January. Uptrends remain in place but stock markets are at risk of falling deeper into a more prolonged correction if recent price support levels are broken.
Trade is expected to remain a key driver of investor sentiment heading into this week with Chinese President Xi Jinping planning to deliver an . Later in the week there is hope for a on revisions to the North American Free Trade Agreement (NAFTA) as President Trump, with the Canadian Prime Minister Justin Trudeau and Mexico’s President Enrique Pena Nieto in Peru at the Summit of the Americas.
Also next week, will pick up and surprises can have a respective impact on the market as a whole.
Japan’s Nikkei 225 Index: Bullish wedge breakout
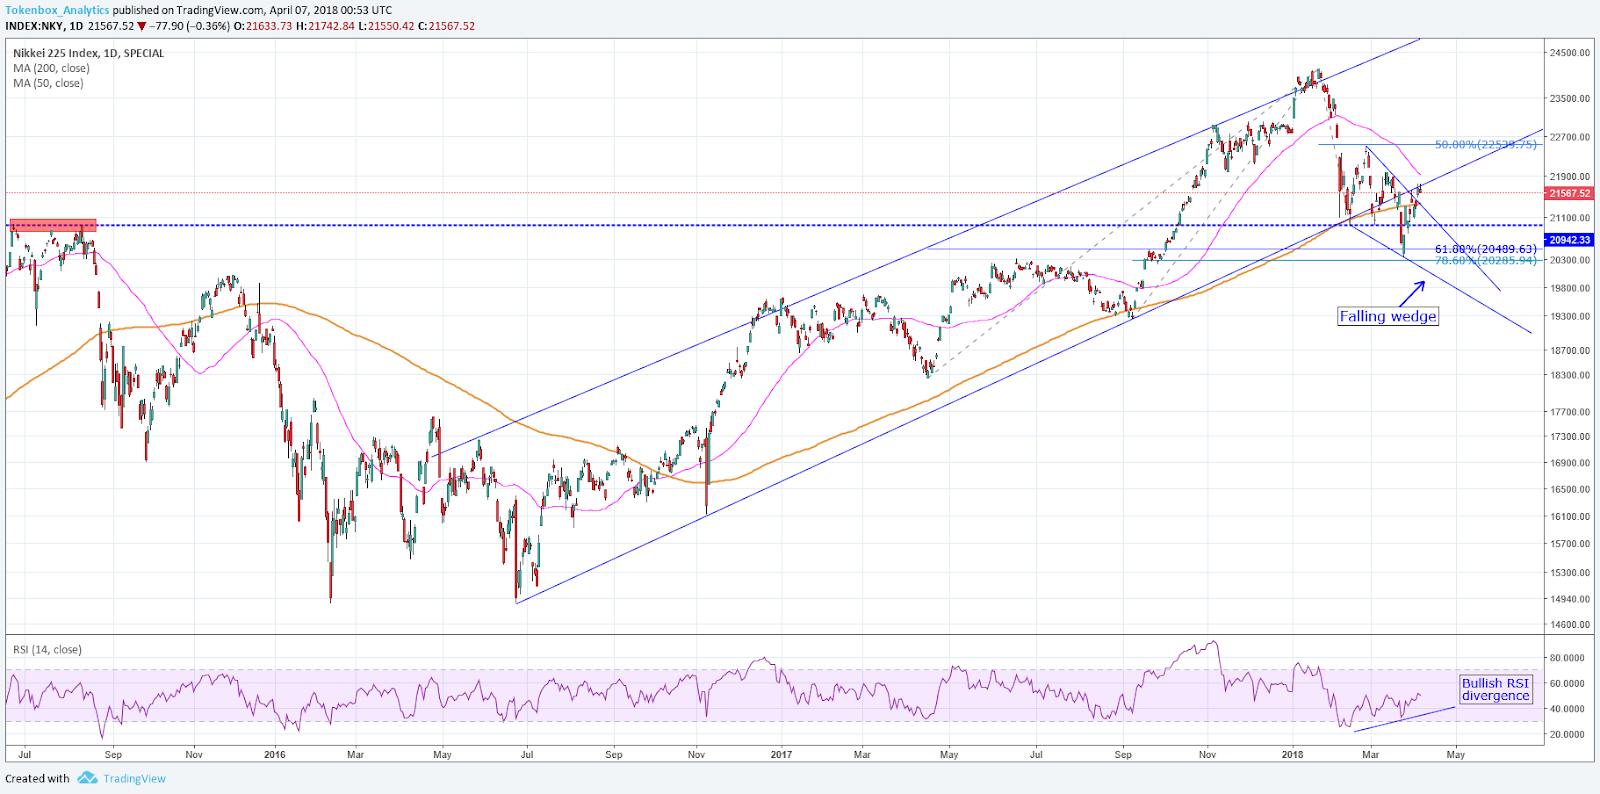
Last week the was up 0.53% as it broke out of an early-stage bullish falling wedge. It remains to be seen whether upward momentum will be enough to propel the index back above the lower ascending trend channel line where resistance was seen last week.
The breakout did take the index back above the 200-day simple moving average (SMA) (brown), a positive by itself. On the first leg down off the January high support was seen at the 200-day line, which led to a bounce to resistance at 22,502.05. That’s now the potential target from the bullish wedge breakout. However, if the Nikkei does break above the uptrend line, the 50-day SMA resistance zone is close by. It is now at 21,922.87.
In the short term a pullback towards support of the 200-day SMA, now at 21,550.42, could be seen before the index takes another run at resistance.
Hang Seng Index: Weighed down
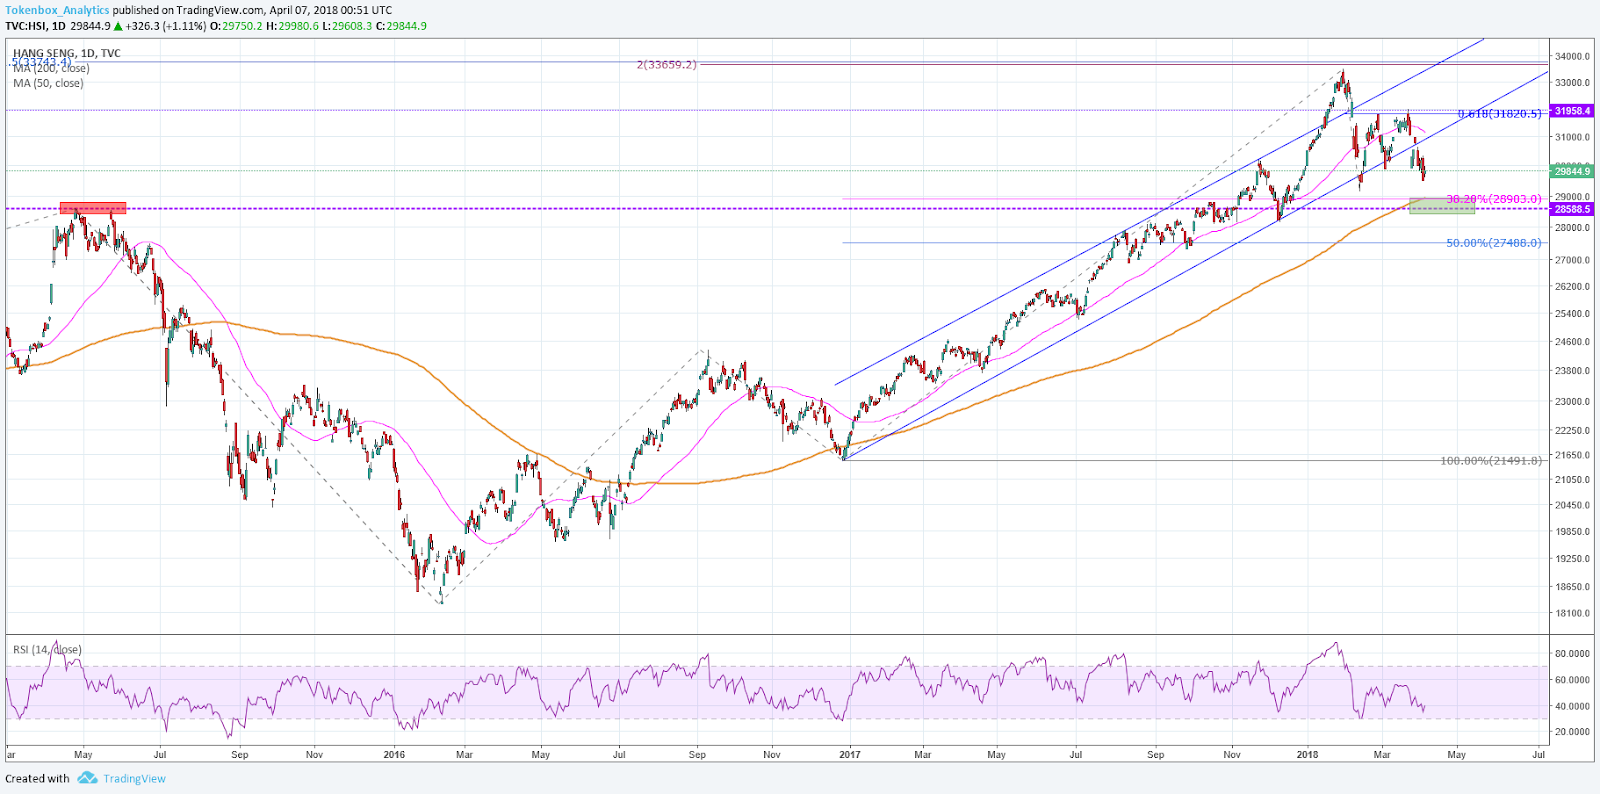
Hong Kong’s has remained under pressure for the past several weeks as it closed lower each time and remains below its uptrend line (lower ascending trend channel). Last week it closed down 0.83% to the lowest weekly close in eight weeks and looks to be heading to its next key trend support zone around the 200-day SMA.
The 200-day line, now at 28,927.75, can be combined with the 38.2% Fibonacci resistance line at 28,903.00 and prior resistance (now potential support) around 28,588.50 from 2015, to create the next major target zone if the index keeps falling. If instead the index rallies, it will have to contend with a good amount of potential resistance before it could get going.
Cryptocurrencies:
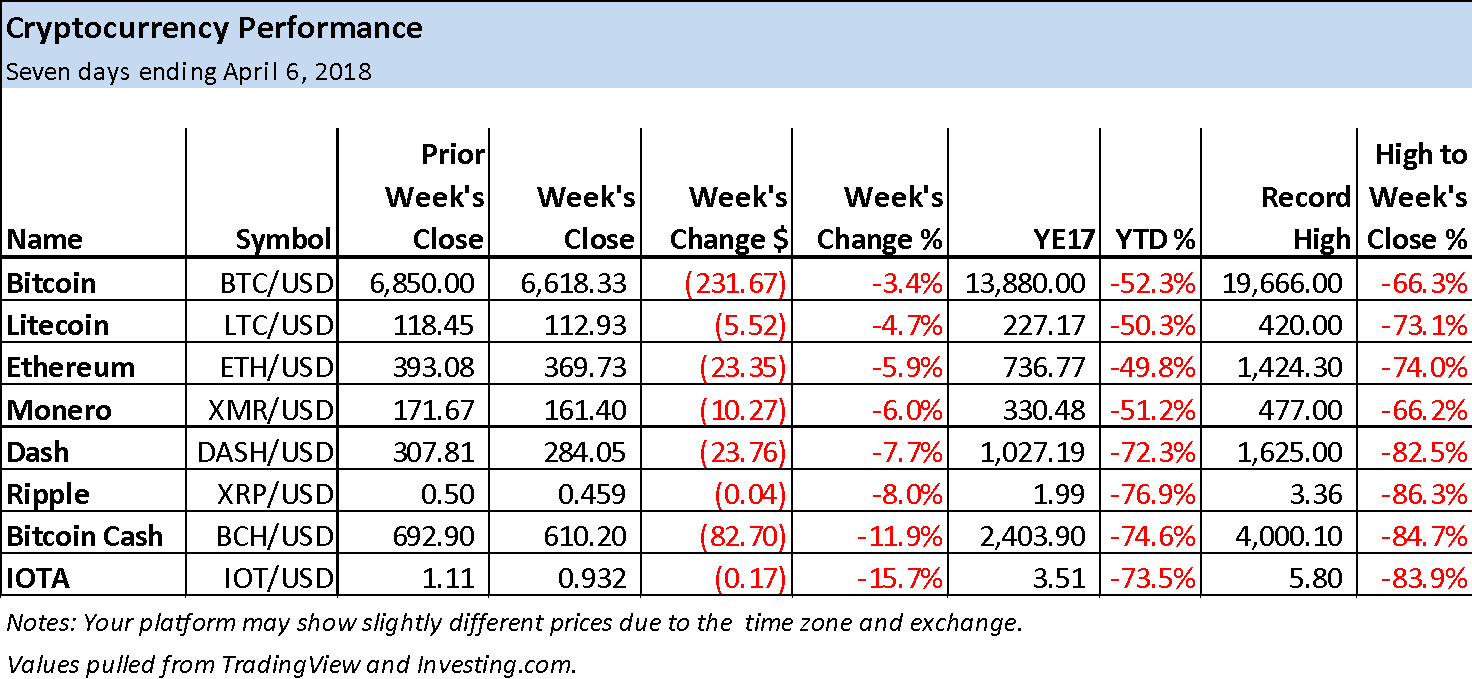
All of the major cryptocurrencies in the accompanying chart were down last week with prices under pressure into the close. and dipped below the prior week’s low but have not seen downward momentum pick up just yet, while the others held above support of the previous week’s low.
Bearish trends are expected to continue until there is some sign of reversal on either daily or intraday 2-hour or 4-hour charts. Both and are starting to show potential reversal patterns on their 4-hour charts and these patterns are discussed below.
Why have crypto prices remained under pressure? Thomas Lee, Head of Research at Fundstrat Global Advisors thinks he has an answer – prior to US tax day. Appearing on CNBC last week, Lee referenced his recent report which calculates a minimum of $25 billion in capital gains taxes owed by US bitcoin and cryptocurrency investors for profitable sales that occurred in 2017.
This is a massive amount. Unless most traders put the money for taxes aside at the time of the sales, which is unlikely, investors are going to be selling cryptos they still hold now in order to meet their obligations, thereby putting downward pressure on the prices. Lee feels a recovery will likely not happen until after the tax season but still maintains his $25,000 year-end price target for bitcoin.
Ethereum (ETH/USD): Potential 4-hour head and shoulders bottom
The overall technical situation in Ethereum is bearish as it remains in a clear downtrend. However, a short-term pattern has formed that could lead to a tradeable bounce. So far the decline off the January top of $1,424.30 has been 74.9% as of the most recent low of .
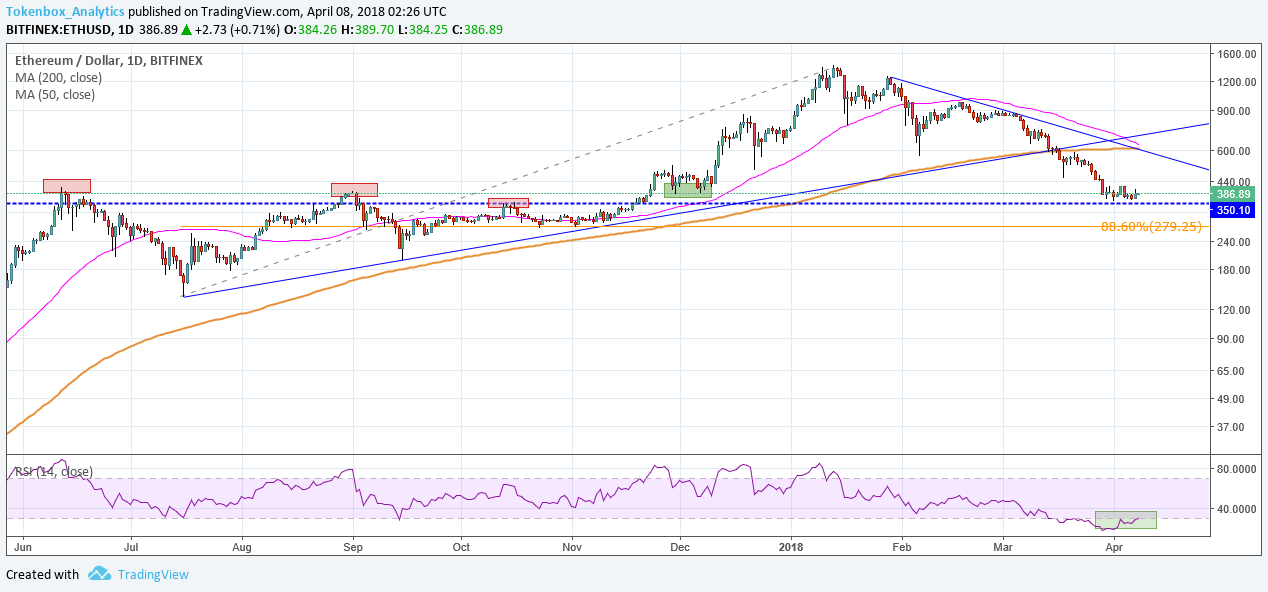
Four weeks ago the downtrend broke through key support of both the uptrend line and 200-day SMA (brown), as can be seen in the daily chart, and it kept falling. Price has since moved clearly below the 200-day line. Nevertheless, the slope of the 200-day line is still rising, although not by much, and the 50-day SMA has not yet closed below the 200-day.
A retracement back towards resistance of the trend line and 200-day SMA at some point is a real possibility, but first there must be a signal to indicate that buyers are getting more aggressive.
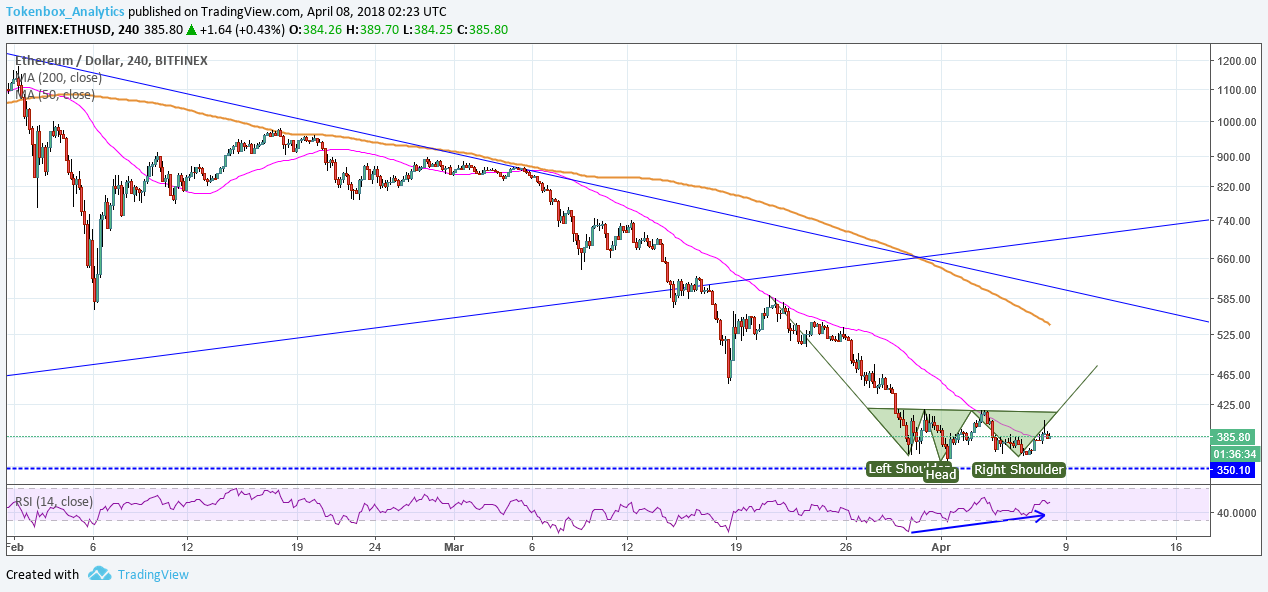
Ethereum has been consolidating essentially sideways for the past nine days or so as it attempts to find some degree of bottom. During that time a potential head and shoulders bottom trend reversal pattern has formed while the Relative Strength Index (RSI) momentum oscillator is showing a bullish divergence.
A bullish breakout of the pattern occurs on a decisive move above $418.79, with a minimum target from the pattern at around $478.67. If Ethereum keeps rising from there, the next level to watch for is resistance around the downtrend line and then the 200-day line, which is now at $612.91.
Alternatively, a drop below $358.00 is a bearish pattern failure.
bitcoin (BTC/USD):
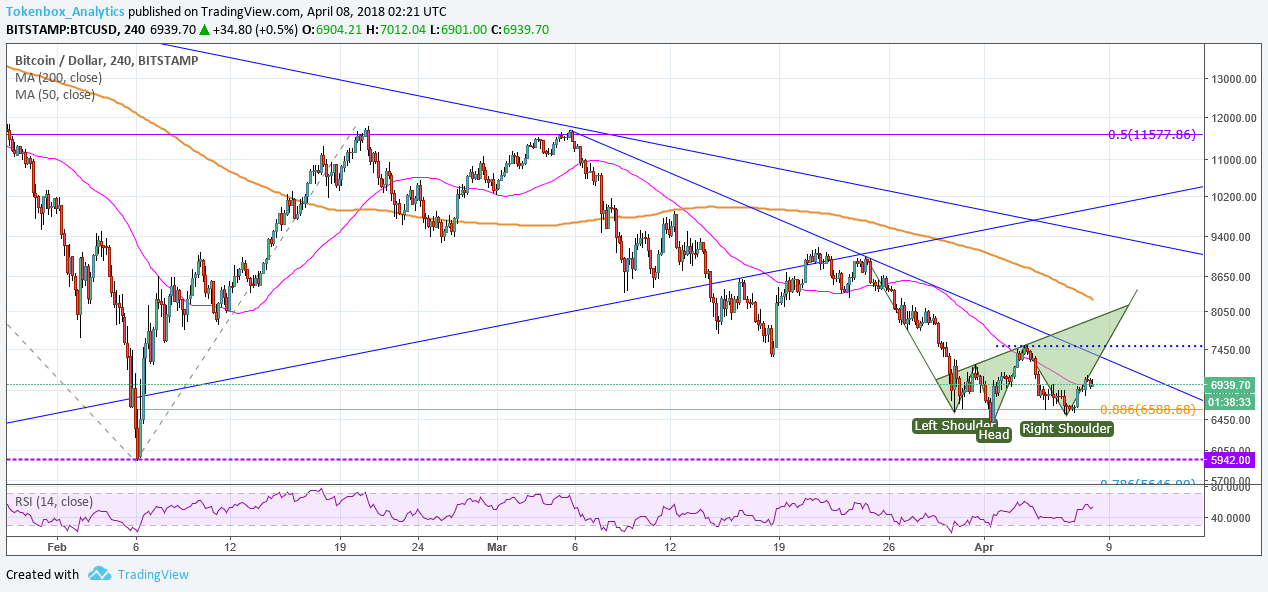
Although not as well formed, bitcoin also shows a possible head and shoulders bottom pattern in its 4-hour chart. A bullish breakout occurs on a move above and is confirmed upon a daily close above that price level.
The minimum target derived from measuring the pattern is approximately $8,422.68. However, higher potential target areas include the 50-day SMA at $9,037.80, followed by the 200-day SMA and downtrend line now around $9,488. A possible failure and bearish signal is first indicated on a drop below the right shoulder at $6,510 and confirmed on a move below the head at $6,427.16.
The market data is provided by theexchange; the charts for the analysis are provided by.
Published at Sun, 08 Apr 2018 20:52:56 +0000
Altcoin[wpr5_ebay kw=”bitcoin” num=”1″ ebcat=”” cid=”5338043562″ lang=”en-US” country=”0″ sort=”bestmatch”]