October 12, 2026

Capitalizations Index – B ∞/21M

Crypto Market Staging Comeback: Bitcoin Cash, XLM, EOS, TRX Price Analysis

Crypto market staging comeback: bitcoin cash, xlm, eos, trx price analysis

Crypto Market Staging Comeback: Bitcoin Cash, XLM, EOS, TRX Price Analysis

  • The total crypto market cap is currently consolidating below the $167.0B resistance.
  • bitcoin cash price is currently above $260 and it could rebound towards $270 and $275.
  • EOS price is likely to climb slowly above the $4.75 and $4.80 resistance levels.
  • Stellar (XLM) price is making an attempt to move back above the $0.1000 resistance.
  • Tron (TRX) could test the $0.0245 resistance, where seller are likely to appear.

The crypto market cap is likely to recover along with bitcoin (BTC) and Ethereum (ETH). BCH, stellar (XLM), ADA, EOS, ripple and tron (TRX) could correct higher in the short term.

bitcoin Cash Price Analysis

bitcoin cash price declined heavily in the past three days after it settled below the $300 support against the US Dollar. The BCH/USD pair broke the $290 and $280 support levels. It even tested the $260 support and currently consolidating gains above the $260 level.

On the upside, the $270 level may act as a strong resistance, above which the price is likely to climb above the $275 level in the near term.

Stellar (XLM), EOS and Tron (TRX) Price Analysis

EOS price was under a lot pressure as it broke the $5.00 and $4.80 support levels. The price traded close to the $4.50 support and recently recovered above $4.70. On the upside, there are a few important hurdles near the $4.75 and $4.80 resistance levels. On downside, the main supports are $4.62 and $4.50.

Stellar price settled below the main $0.1020 and $0.1000 support levels. It is currently correcting higher and it could make an attempt to climb back above the $0.1000 level. The next key resistances are near $0.1020 and $0.1040. On the downside, the main supports are $0.0975 and $0.0960.

Tron price remained in a strong downtrend below the $0.0250 support level. TRX price broke the $0.0240 support and recently traded close to the $0.0225 level. It is currently correcting higher and it may perhaps test the $0.0245 resistance.
Crypto market cap bitcoin cash bch eos trx xlm btc

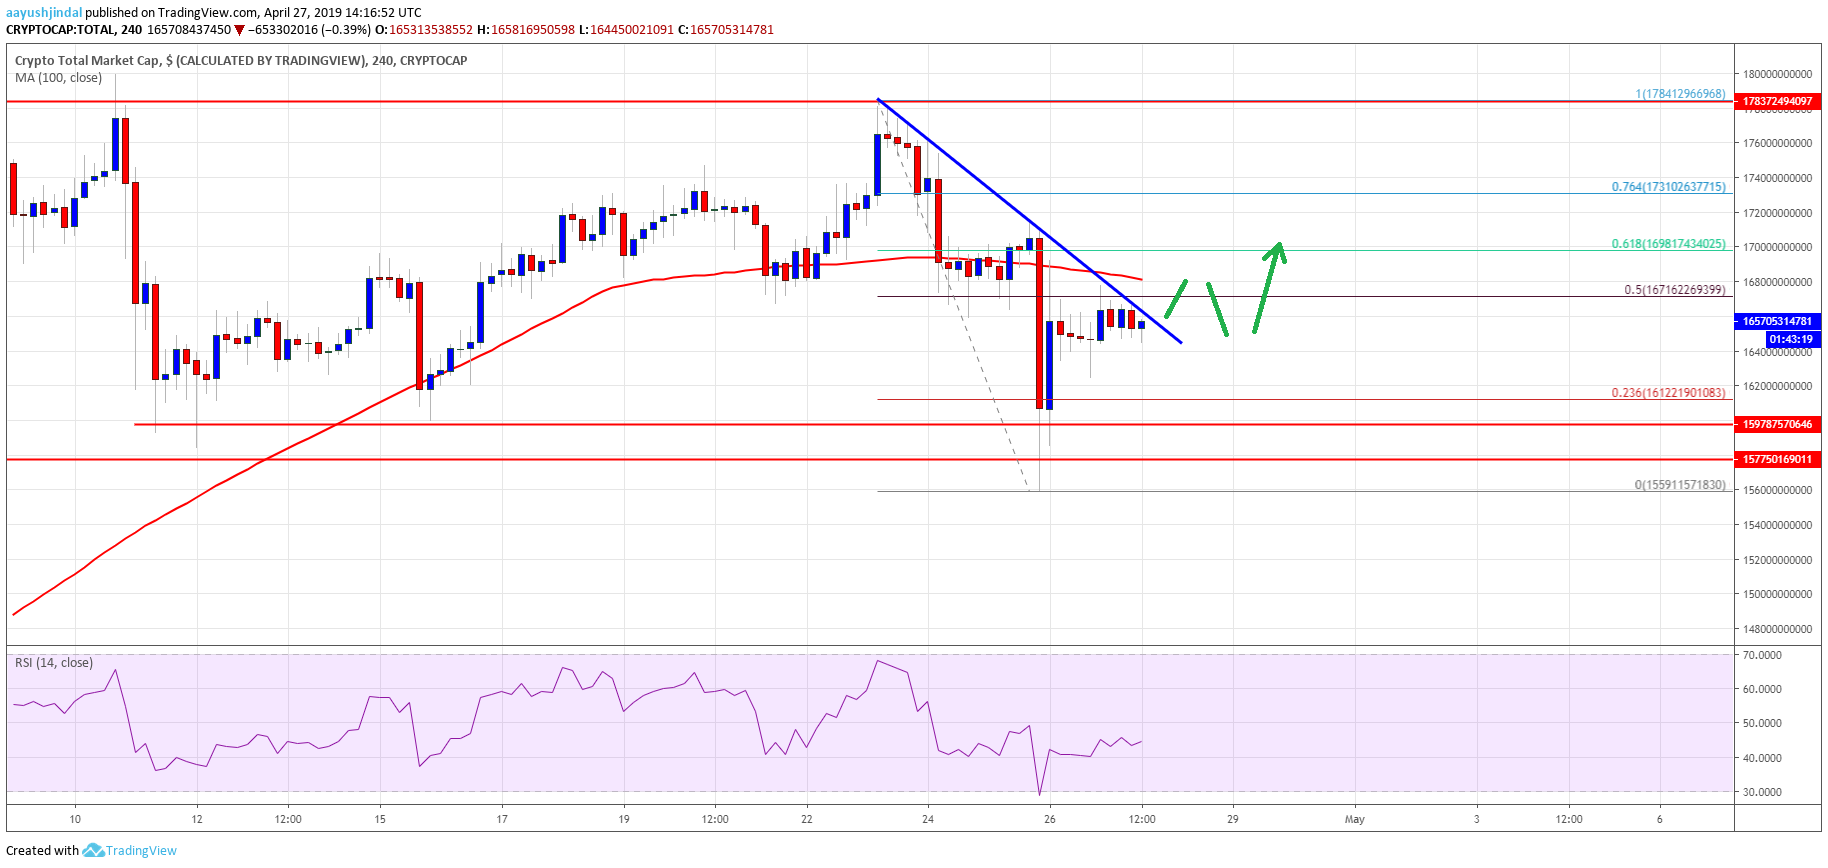
Looking at the total cryptocurrency market cap hourly chart, there was a strong rebound from the $158.0B and $160.0B support levels. The market cap is now above the $164.0B level and it is likely to break a crucial bearish trend line with resistance at $166.0B. A successful close above the $166.0B and $167.0B resistance levels may open the doors for more upsides. The next key resistance is at $170.0B, where sellers may emerge. On the other hand, a failure to clear the $167.0B resistance might trigger bearish moves in the near term. Overall, there are high chances of a strong recovery in bitcoin, Ethereum, EOS, ripple, litecoin, bitcoin cash, XLM, TRX, WAN, WTC, ICX, and other altcoins in the near term.

Published at Sat, 27 Apr 2019 15:08:12 +0000

Previous Article

Bexplus – Bitcoin Leverage Exchange Helps You Earn BTC Easily

Next Article

MyBit DAO Tutorial – MyBit –

You might be interested in …

Ether Price Analysis: Decrease in Buy Volume Pushes Price Lower

Ether Price Analysis

Over the past week, ETH-USD markets have seen a steady bleed as prices have slumped lower and lower. Any buy-back volume the markets managed to see was gradually eroded as the overall trend headed downward:

ETHUSD Macro Trend.png

Figure 1: ETH-USD, 4HR Candles, Gemini, Descending Trendline

As predicted in last week’s ETH-USD analysis, a failure to see any significant increase in buy volume led the market to see further tests of the Fibonacci Retracement values. At the time of this article, the market is rejecting the neckline of the previous Double Bottom Reversal (shown in yellow and noted at the 61% retracement values) and has moved on to retest the 50% retracement:

ETHUSD Fib Retracement.png

Figure 2: ETH-USD, 1HR Candles, GDAX, Fibonacci Retracement Values

Multiple tests of the 50% and 61% values are very common in both downward and upward trends and can sometimes provide great opportunities for short-term market trades due to the predictable support and resistance values. Today’s rejection of the 61% line is not entirely surprising; a lot of volume entered the market upon the arrival of the Double Bottom Reversal from last week, marking a potential turnaround from a strong bear market to a short-lived bull market. Ultimately, after failing to retrace the downtrend of the previous bear market, the bullish trend subsided and continued its way toward lower values.

In the coming days, don’t expect to see any strong upward movement from ETH-USD markets without a test of lower values. As we continue to test the Fibonacci Retracement values, we can expect to see some turbulence surrounding another test of the 50% and ultimately a test of the 61% values. If we manage to slide below the 61% line, there isn’t much in terms of support before the market reaches the lower $200s. A drop below the 61% line could lead to another slip of $50 as the market will ultimately try to find its next line of support.

Summary:

  1. The ETH-USD price has seen a slow descending trend as multiple tests of the established Fibonacci Retracement values have continued.

  2. If ETH-USD drops below the 61% Fibonacci Retracement values, a pullback to the $200s is most likely — this is a significant level of support below the $250s.

Trading and investing in digital assets like bitcoin and ether is highly speculative and comes with many risks. This analysis is for informational purposes and should not be considered investment advice. Statements and financial information on bitcoin Magazine and BTCMedia related sites do not necessarily reflect the opinion of BTCMedia and should not be construed as an endorsement or recommendation to buy, sell or hold. Past performance is not necessarily indicative of future results.

The post Ether Price Analysis: Decrease in Buy Volume Pushes Price Lower appeared first on Bitcoin Magazine.