Key Highlights
- ADA price is showing positive signs and is currently trading above the $0.3150 support against the US Dollar (tethered).
- There is a major contracting triangle forming with resistance at $0.3330 on the hourly chart of the ADA/USD pair (data feed via Bittrex).
- The pair may perhaps break the $0.3330 and 0.3360 resistance levels to gain upside momentum.
Cardano price is slowly moving higher against the US Dollar and bitcoin. ADA/USD is likely to extend gains above the $0.3400 resistance in the near term.
Cardano Price Resistance
There was a initiated in ADA price from the $0.2900 swing low against the US Dollar. The price made a nice upside move and traded above the $0.3000 and $0.3100 resistance levels. There are many positive signs emerging since the price is now above $0.3250. However, there is a major resistance near the $0.3400 level, which must be breached for more gains.
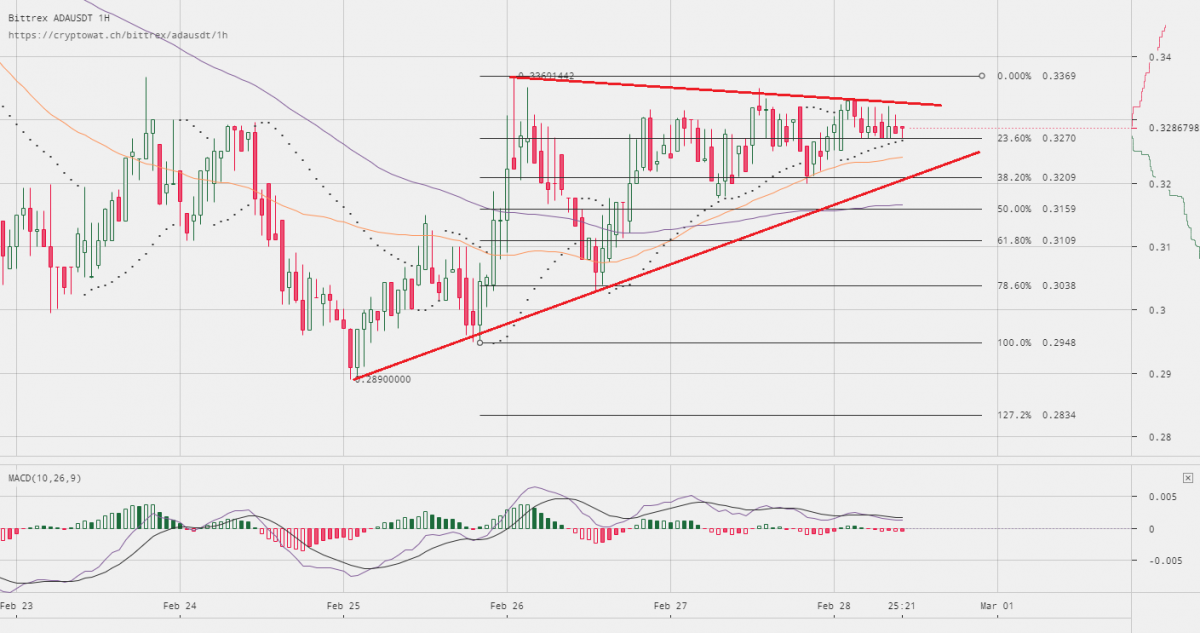
There was a high formed at 0.33669 recently from where a downside correction was initiated. ADA declined and moved below the 50% Fib retracement level of the last wave from the $0.2948 low to $0.3370 swing high. The downside move was protected by the $0.3000 support. Moreover, the 76.4% Fib retracement level of the last wave from the $0.2948 low to $0.3370 swing high also acted as a support. The current price structure is above the $0.3200 level. It seems like there is a major contracting triangle forming with resistance at $0.3330 on the hourly chart of the ADA/USD pair.
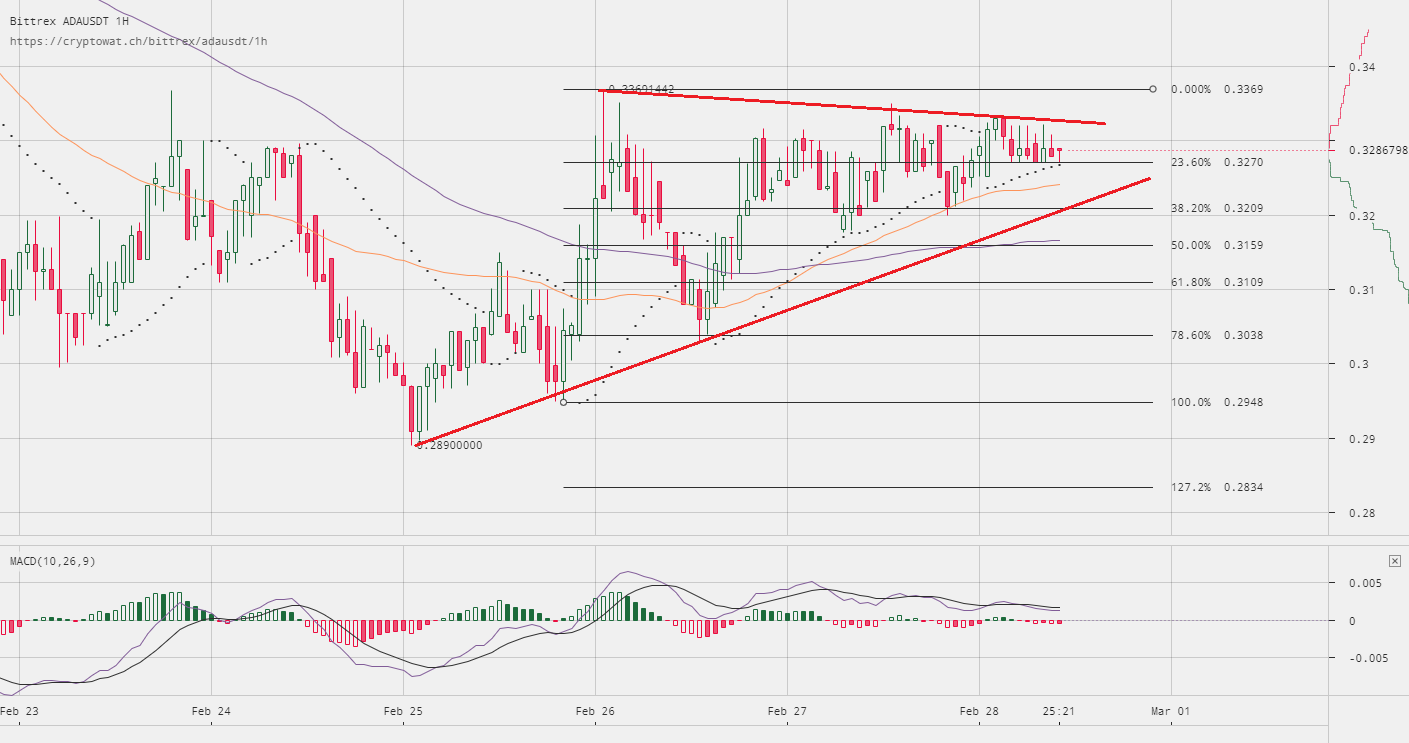
The pair must break the triangle resistance at $0.3330 to gain upside momentum. Above $0.3330, the next major resistance is around the $0.3400 level. A proper close above $0.3400 could trigger an upside wave towards the $0.3800 and $0.4000 levels.
Hourly MACD – The MACD for ADA/USD is currently in the bearish zone.
Hourly RSI – The RSI for ADA/USD is just around the 50 level.
Major Support Level – $0.3250
Major Resistance Level – $0.3400
Charts courtesy –
Published at Wed, 28 Feb 2018 08:00:57 +0000
Analysis

