Key Highlights
- ADA price topped around the $0.3200 level and started a sharp downside correction against the US Dollar (tethered).
- There was a break below a major bullish trend line with support at $0.2900 on the hourly chart of the ADA/USD pair (data feed via Bittrex).
- The pair is currently trading near a key support at $0.2700, which holds a lot of importance.
Cardano price started a downside correction against the US Dollar and bitcoin. ADA/USD must stay above $0.2700 to remain in a bullish zone.
Cardano Price Decline
There was a above $0.3000 in ADA price against the US Dollar. The price moved above the $0.3200 level and traded as high as $0.3203. Later, sellers appeared and the price started a downside correction below $0.3000. There was a sharp decline, which resulted in a push below the $$0.2900 support and the 100 hourly simple moving average.
More importantly, there was a break below a major bullish trend line with support at $0.2900 on the hourly chart of the ADA/USD pair. The pair settled below $0.3000 and the 100 hourly SMA. However, a around $0.2700 came into the picture and prevented further declines. A low was formed at $0.2719 before the price got stable. It recovered and tested the 38.2% Fib retracement level of the last decline from the $0.3203 high to $0.2719 low. However, the price is facing a major barrier near the broken support at $0.2900 and the 100 hourly SMA.
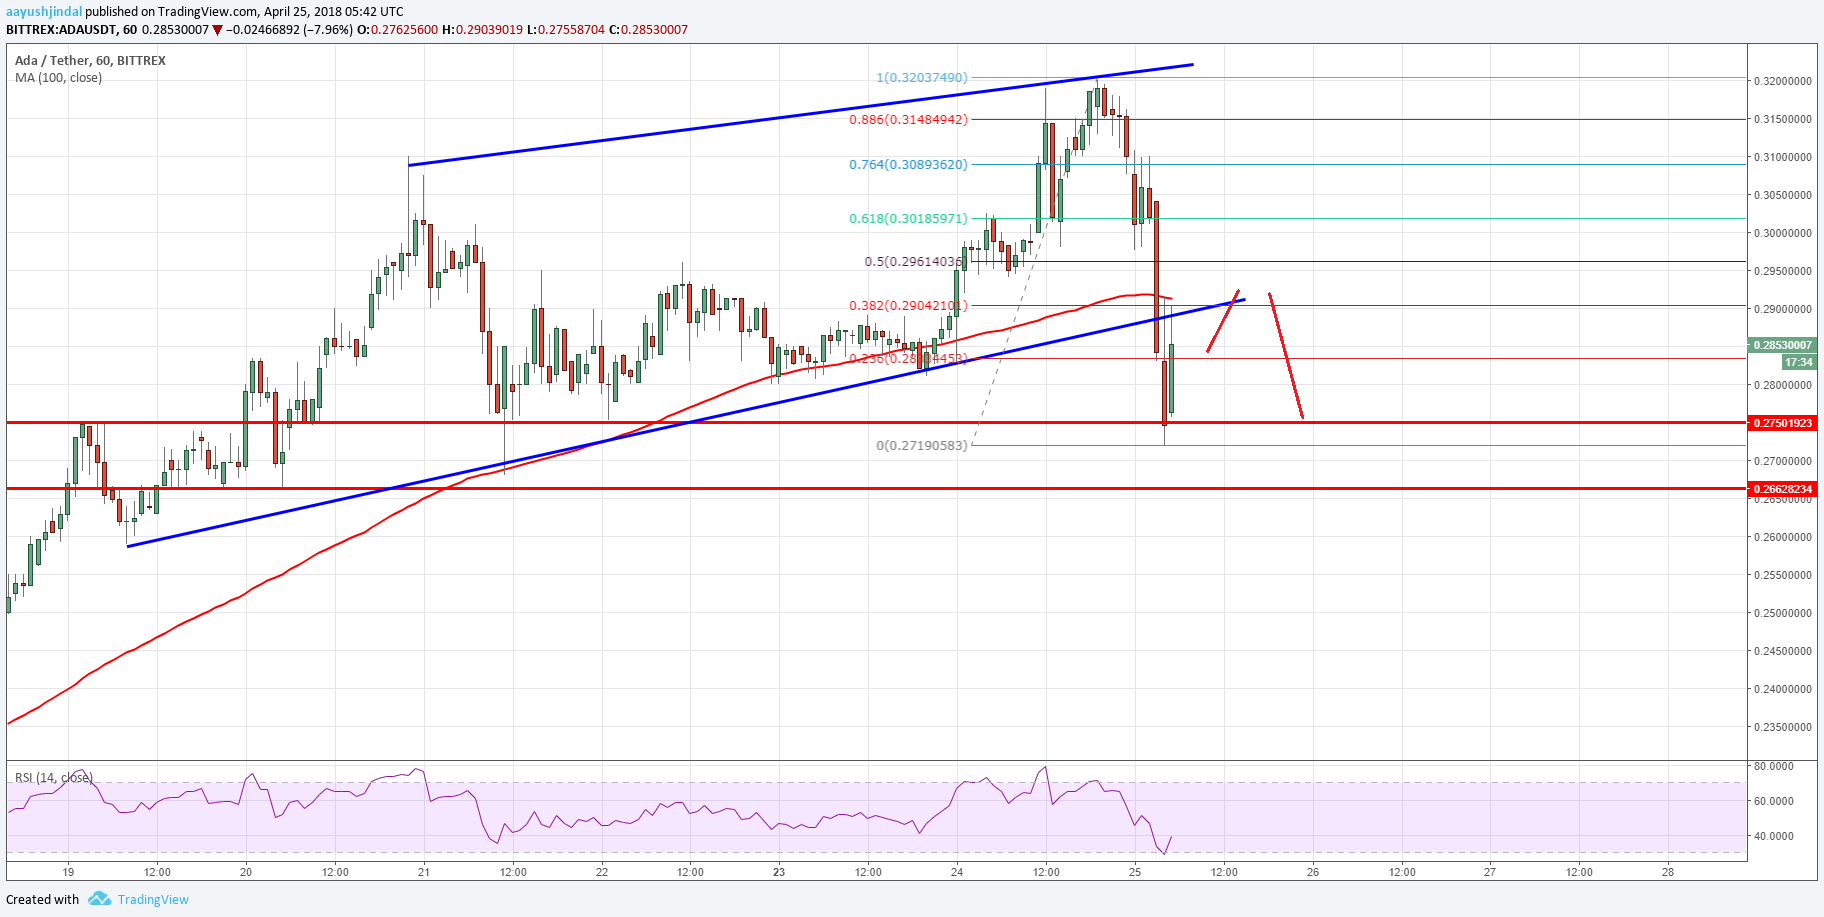
The suggests that the price is also struggling to move above the broken trend line and $0.2880. Looking at the current price action, there are chances of a short-term consolidation above $0.2700 before the price resumes its uptrend. Resistances on the upside are at $0.2900, $0.3000 and $0.32000.
Hourly MACD – The MACD for ADA/USD is now in the bearish zone.
Hourly RSI – The RSI for ADA/USD is moving higher from the 30 level.
Major Support Level – $0.2700
Major Resistance Level – $0.2900
Published at Wed, 25 Apr 2018 08:00:12 +0000
Analysis