Key Highlights
- ADA price corrected lower from the $0.2745 level, but downsides were limited against the US Dollar (tethered).
- There is a major bullish trend line forming with support near the $0.2400 level on the hourly chart of the ADA/USD pair (data feed via Bittrex).
- The pair is likely to find a strong buying interest above the $0.2400 level in the short term.
Cardano price is placed nicely in a bullish zone against the US Dollar and bitcoin. ADA/USD downsides remain limited with supports near $0.2400 and $0.2300.
Cardano Price Support
After a , ADA price found selling interest near the $0.2745 level against the US Dollar. The price made a short-term top near the $0.2746 level and started a downside move. It declined and moved below the $0.2700 and $0.2600 support levels. Moreover, there was a break below the 23.6% Fib retracement level of the last wave from the $0.2120 swing low to $0.2745 swing high.
However, the decline was limited and the price found support near the $0.2400 level. More importantly, the 50% Fib retracement level of the last wave from the $0.2120 swing low to $0.2745 swing high is currently acting as a support. There is also a major bullish trend line forming with support near the $0.2400 level on the hourly chart of the ADA/USD pair. Therefore, it seems like the pair is well supported above the $0.2400 level. Below $0.2400, the price may test a near $0.2300.
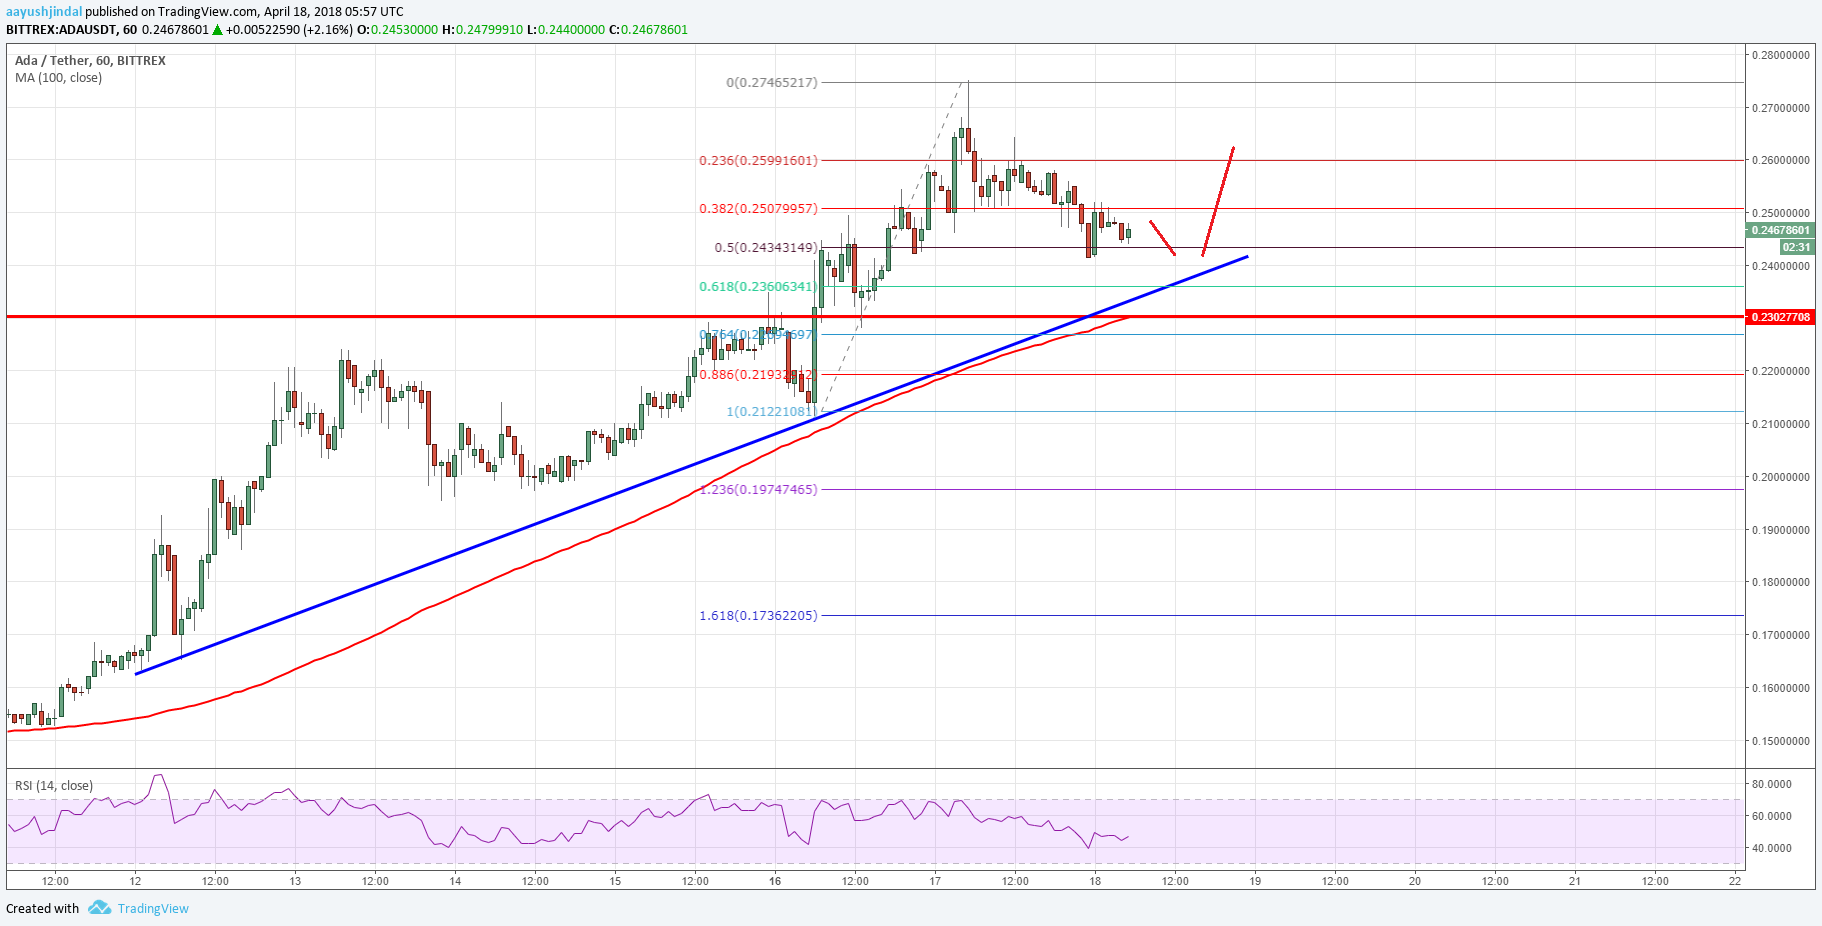
The suggests that the price may correct a few points toward $0.2400 in the short term. However, declines are likely to be limited since the $0.2400 support is very significant. On the upside, the price faces an initial resistance at $0.2550. A push above $0.2550 could open the doors for an upside move towards $0.2700.
Hourly MACD – The MACD for ADA/USD is currently in the bearish zone.
Hourly RSI – The RSI for ADA/USD is moving higher towards the 50 level.
Major Support Level – $0.2400
Major Resistance Level – $0.2700
Published at Wed, 18 Apr 2018 08:00:42 +0000
Analysis


