May 7, 2026

Capitalizations Index – B ∞/21M

Bullish Bitcoin (BTC) Price Nears $7,000 in Huge Rally, is $8,000 Next? ₿📊📈⚡🚀

Bullish bitcoin Price Nears $7,000 in Huge Rally, is $8,000 Next? ₿📊📈⚡🚀

The bitcoin price has climbed to $6,964 on the day’s peak in major markets like the U.S., recording a staggering 9 percent rise within 24 hours, bringing its one month gain to 23 percent and fueling the crypto market.
Traders were initially cautious about the near-term price trend of bitcoin as large resistance served as a potential roadblock for the asset to continue its upward momentum.

The bitcoin price has recorded a 9 percent gain in the past 24 hours (source: coinmarketcap.com)

The bitcoin price comfortably broke out of the $6,000 level, climbing to September 2018 levels at nearly $7,000.
What’s Next For bitcoin?
Year-to-date, bitcoin has gained more than 84 percent, outperforming most traditional asset classes and commodities.
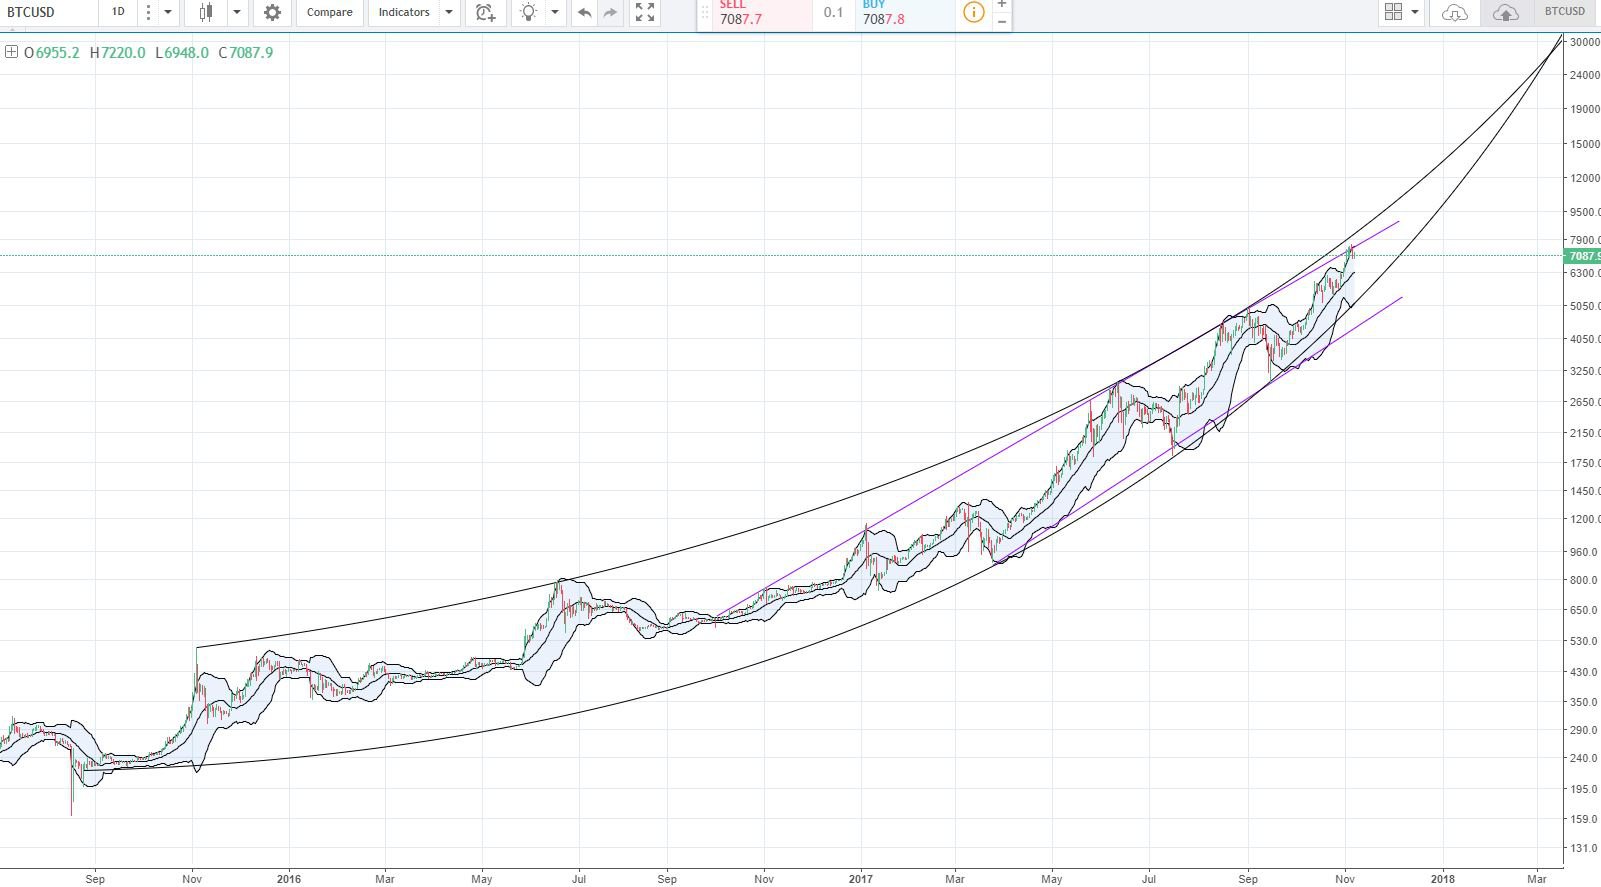
On Thursday, Adaptive Capital head of research David Puell stated that the bitcoin price has moved from a parabolic stage to vertical, raising the possibility of the bitcoin price rising from $6,300 to over $7,000.

“Price is not only parabolic, but vertical now. Shorts are still far from getting fully squeezed. $6.4k may activate longs from late trend traders, setting up the perfect blow-off to,” Puell said.

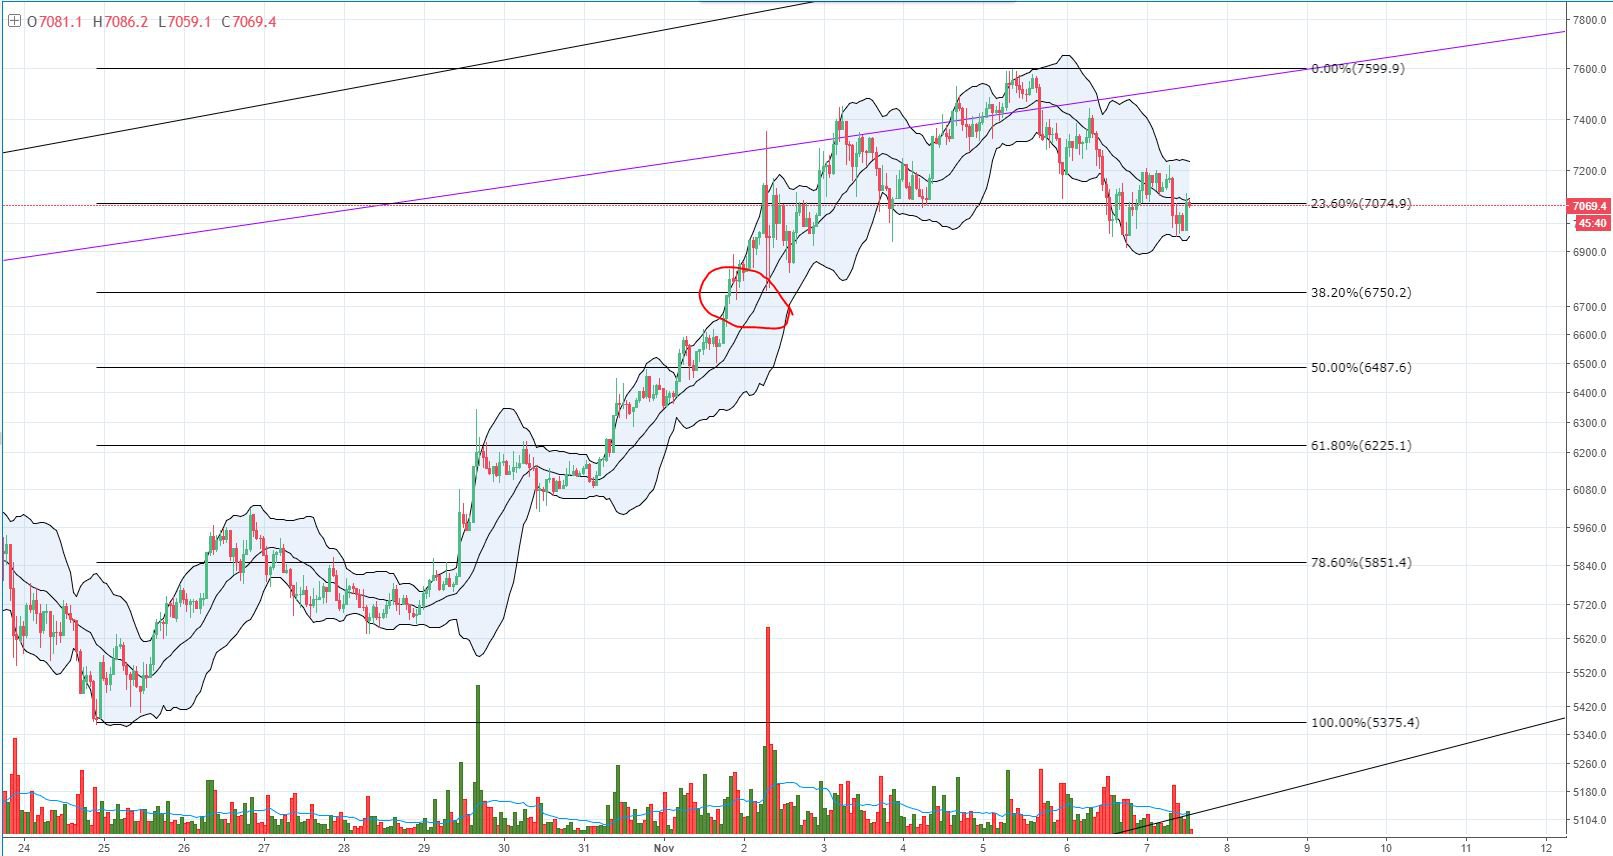
Following the break out of bitcoin over $6,000 and the substantial increase in its price on the day, global markets analyst Alex Krüger ‏said that bitcoin is now in a bull market territory, with resistance found at $7,000 and $8,000.
A potential entry into the $7,000 to $8,000 range, which would allow bitcoin to recover to July 2018 levels, would require a strong stimulus to further fuel the momentum of the dominant cryptocurrency.

The valuation of the crypto market increased by more than $10 billion on the day (source: coinmarketcap.com)

“BTC now in bull market territory after an intraday blow-off top. R: 7000, 8000 S: 6400, 6000 Old levels not as valuable, hence why above 6400 only looking at round numbers as major resistance. Hourly volume at Bitmex was the 2nd largest ever after Sep/5/18,” he said.

One possible catalyst of the bitcoin price in the near-term is a potential short squeeze that could lead the liquidation of short contracts to add to the momentum of BTC.
Willy Woo, the founder of WooBull.com, explained the process in which a short squeeze occurs, mostly when a chain reaction of liquidation leads the price of the asset to experience a vertical movement.
He noted:

All this happens without any on-chain activity. As it’s an exchange driven game, no real investors are buying into the rally. Get the popcorn out, let’s see if the squeeze completes…. Look for the Bitfinex shorts (red line to drop) and the BitMEX funding rate to go positive.

4) A tidal wave of buys cascade through the orderbooks, a chain reaction, the price goes vertical.
5) Whale payday. The whales that bought up the market sheparding the price up now dump their positions at profit.
6) Blow-off. The price comes down to its organic levels.
— Willy Woo (@woonomic) May 11, 2019

Although the bitcoin price has already recorded a large gain since early May, a short squeeze could still allow the asset to test the $7,000 to $8,000 range, which most technical analysts dismissed prior to the asset’s clean break out of $6,000.
Fundamental Factors
On the fundamental side, Barry Silbert, the founder and CEO of Digital Currency Group, said that the trading volume of the bitcoin Investment Trust (GBTC) surpassed $50 million on Friday, becoming the most actively traded stock on OTC Markets.

Trading volume on Grayscale bitcoin Trust (symbol: $GBTC) exceeded $50 million today and was again the most actively traded stock on @OTCMarkets OTCQX https://t.co/wcaCcYNIqg
— Barry Silbert (@barrysilbert) May 10, 2019

GBTC is primarily utilized by accredited investors to invest in bitcoin in a transparent and regulated environment.
The steady inflow of institutional capital in the past 12 months as seen in the 2018 annual report of Grayscale and the newly released survey of Fidelity suggests that a growing number of accredited and institutional investors are committing to the market.

“According to the survey, about 22% of institutional investors already have some exposure to digital assets, with most investments having been made within the past three years. Four in ten respondents say they are open to future investments in digital assets over the next five years,” the report of Fidelity Digital Assets read.

More info at http://bit.ly/2HdY3wU

Previous Article

6 Smartphones Able to Store or Mine Cryptocurrency

Next Article

Bitcoin Will Make 5% of Earth’s Market Share in 4 Years: Billionaire VC Tim Draper ₿👍⚡🚀

You might be interested in …

Bitcoin Price Analysis: Bitcoin’s All-Time High Tests a Historic Reversal Point

Bitcoin Price Analysis

For months on end, BTC-USD had a strong bullish rally that has been well confined between both a linear ascending channel and (on a macro scale) a parabolic curve:

Figure_1 (18).JPGFigure 1: BTC-USD, 1-Day Candles, Linear and Parabolic Trendlines

After a very strong, bullish rally, bitcoin managed to settle on a new all-time high in the $7,500s. This price peak bounced right off the upper linear ascending trendline shown in Figure 1. Historically, every time bitcoin has touched the upper ascending trendline, the market has gone through a corrective phase and entered into a relatively strong bearish reversal. At the time of this article, bitcoin is currently testing key, macro support of the lower $7,000 price range:

Figure_2 (15).JPGFigure 2: BTC-USD, 1-Hour Candles, Macro Support

The 23% Fibonacci support has been a point of interest in the market’s history and will prove to be strong support. BTC-USD has attempted to break this support level a couple of times already and we are currently making a third test. A break below this level of support could send the price down to the 38% retracement values and test the $6,700 prices. However, if we look at the previous price action (the red circle) that brought the price upward, we don’t see any consolidation or support in the market’s history. This tells us that the 38% price level most likely won’t prove to be significant support during a potential move downward and we can expect to find stronger support in lower values around the $6,400–$6,500 prices.

Historically, during correction periods, bitcoin has retraced 50–61% of the initial bull run:

Figure_3 (14).JPGFigure 3: BTC-USD, 12-Hour Candles, Retracement Trend

The 50–61% retracement trend has formed a very nice, consistent ascending trendline for the lower support values. Unfortunately in this case, a retracement to the lower trendline would shove us outside the parabolic envelope described in the last bitcoin market analysis. On a macro level, if we do continue on a macro retracement to the 50–61% retracement values, we will likely find support on the lower parabolic curve in the $5,300s.

Overall, bitcoin appears to be experiencing a slow bleed and will likely continue until some buying pressure picks up on the market. In general, the bullish pressure is somewhat exhausted, and if there is a resumption of an uptrend, we will likely see support and bullish continuation off the 23% retracement and $6,500 values outlined in Figure 3.

Right now, bitcoin is in a precarious situation because it’s sitting just above support at the $7,000 level and doesn’t appear to have any interest in climbing back up just yet. Keep an eye on this support level and watch for a rise in volume on the next test of support. If we break this support level, it’s likely to continue downward for several hundred dollars before finding support once again.

Summary:

  1. bitcoin topped out its all-time high at the upper boundary of a macro, linear trendline.

  2. Historically, a test of this trendline has prompted a market correction — it is likely that this trend will continue.

  3. We are testing key support at the $7,000 price level and a move below this support will signal a continuation of the down trend.

Trading and investing in digital assets like bitcoin and ether is highly speculative and comes with many risks. This analysis is for informational purposes and should not be considered investment advice. Statements and financial information on bitcoin Magazine and BTC Media related sites do not necessarily reflect the opinion of BTC Media and should not be construed as an endorsement or recommendation to buy, sell or hold. Past performance is not necessarily indicative of future results.

The post Bitcoin Price Analysis: Bitcoin’s All-Time High Tests a Historic Reversal Point appeared first on Bitcoin Magazine.

Bitcoin daily liquidity capture (btc)

Bitcoin Daily Liquidity Capture (BTC)

bitcoin Daily Liquidity Capture (BTC) EN English (UK) EN English (IN) DE Deutsch FR Français ES Español IT Italiano PL Polski SV Svenska TR Türkçe RU Русский PT Português ID Bahasa Indonesia MS Bahasa Melayu […]