November 5, 2026

Capitalizations Index – B ∞/21M

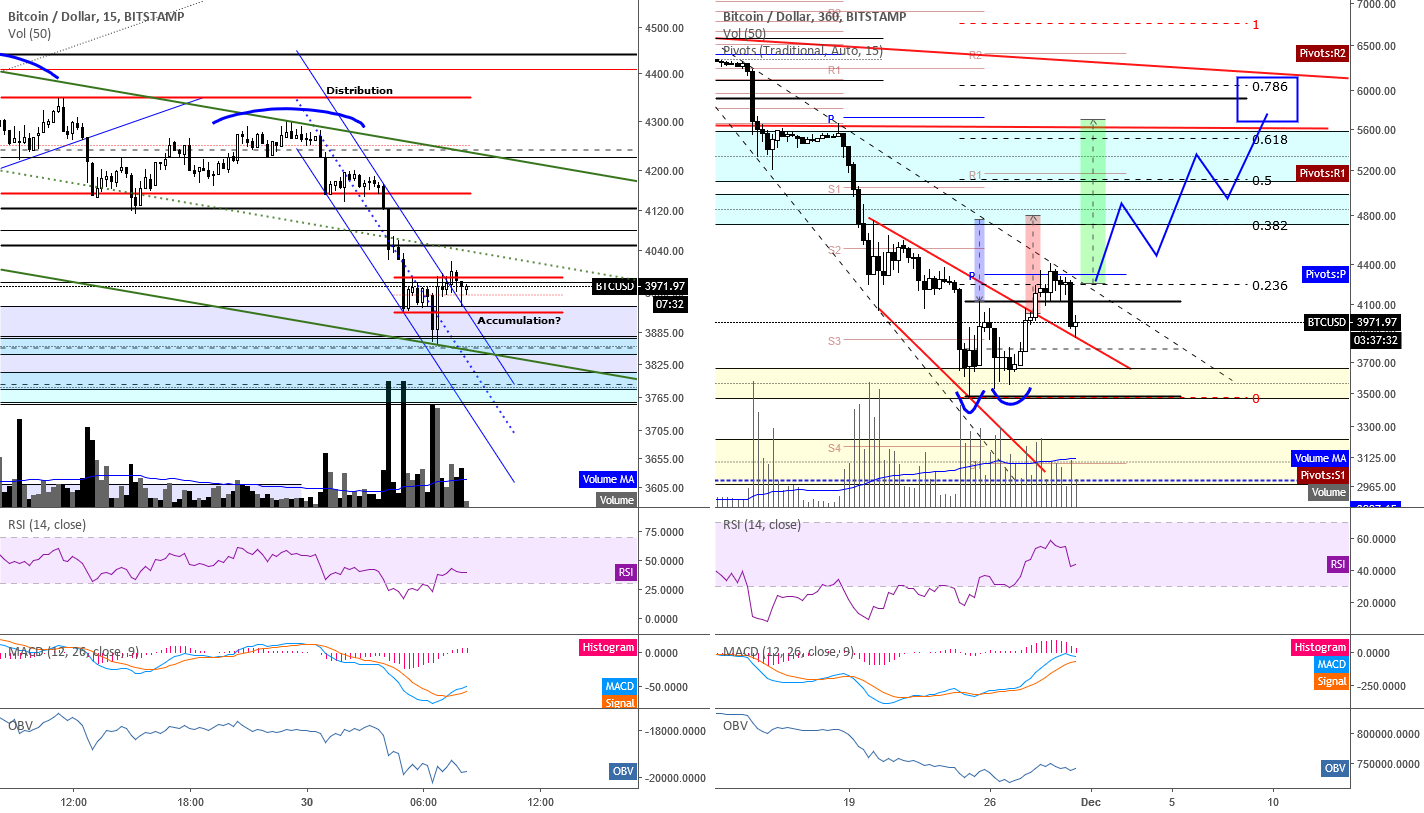
BTC/USD 15 min/6H charts (11/30/2018)

Btc/usd 15 min/6h charts (11/30/2018)

BTC/USD 15 min/6H charts (11/30/2018)

Btc/usd 15 min/6h charts (11/30/2018)

Good morning, traders. We’ve made it to, yet, another Friday. There are a lot of ways to understand price movement and I’ll be discussing a few today. CMEbitcoin futures expire in just a few hours and the volatility that I warned about yesterday is showing itself. So far, this morning’s move aligns with what I discussed yesterday could happen if price moved out of the ascending channel it was in. I said that I would specifically be looking for a bounce in the $3850-$4000 area with the 15 minute S1 pivot located at $3875. Price hit a low of $3861 before bouncing. If you tuned into yesterday morning’s live stream, then you know that at that time I was expecting price to follow this path. At this point, things are looking just as they should. You also may have noticed the Head and Shoulders pattern that printed, so even if you didn’t pay attention or give much thought to what I said, it should’ve had you exiting your long position (if you’re a short TF trader) or going short on the drop through the neckline. Ultimately, the target based on that H&S is around $3827, so there’s always the possibility price could continue to that point. However, the current low on this drop is where the expectation was as of yesterday due to the demand present.

We have bullish divergence printing on the 1H and lower TFs’ RSI this morning and the price low tagged the 61.8% retrace of the move up from the candle that started the previous ascending channel’s support at $3548.76 to the high of $4409.77. I will be looking for price to exit through this current descending channel’s resistance and then to head upward. However, traders who choose to be in the market at the moment shouldn’t lie to themselves about the risk they are taking. With CME expiry happening in a few hours, we should expect more volatility which can easily shakeout traders by hitting their stop losses with sudden price surges and/or drops.

I have added a large green descending channel to the 15 minute chart that I will be watching. At the very least, I expect price to target the top of it. But a push through that resistance should set up an attempt at the double bottom target of $4765. The width of the potential green channel is about $390, so traders could also use that as a target once price breaches the channel’s resistance. If price happens to move lower than the bounce, I will be adjusting the green channel to compensate for that movement. I have adjusted the expected outlined movement if price breaches the large descending broadening wedge on the 6H to compensate for this morning as I mentioned I would yesterday. A push through that wedge’s resistance within the next 24 hours should generate a target of around $5700 based on the width of that wedge . During yesterday’s live stream I discussed the possibility of an Inverse Head and Shoulders pattern forming on the 6H TF, which price is building pretty well at the moment. Current expected target is around $5330-$5350 if the pattern plays out. Don’t forget to watch the monthly candle as well which closes at the end of the trading day, today, and the weekly candle which closes at the end of the trading day, on Sunday. The higher that price ends today, the more bullish that 1M candle potentially becomes, and the higher that price ends the week, the more bullish that possible reversal becomes. These two candles will likely tell you more about the pair’s current state than the 1D or lower candles that everyone’s concentrating on.

Every day, we have a choice to act positively or negatively, so if you get a chance, do something nice for someone today which could be as simple as sharing a nice word with them. You just might change their day or even their life.

Remember, you can always click on the “share” button in the lower right hand of the screen, under the chart, and then click on “Make it mine” from the popup menu in order to get a live version of the chart that you can explore on your own.

Published at Fri, 30 Nov 2018 14:22:30 +0000

Previous Article

Engineering Manager, Poloniex

Next Article

Insurance of Cryptocurrency: Trend in Blockchain Industry

You might be interested in …

Виталик Бутерин намерен ограничить предложение Ethereum 120 миллионами монет

ForkLog Виталик Бутерин намерен ограничить предложение Ethereum 120 миллионами монет Сегодня, 1 апреля, Виталик Бутерин опубликовал новое предложение по улучшению протокола Ethereum (EIP 960), согласно которому максимальный объем предложения может быть ограничен 120 204 432 […]

Blockchain Solar Energy Trading Platform SunContract Raises over 8200 ETH in Ongoing ICO

Unique Solar energy trading platform, SunContract has declared a total of over 8220 ETH (about $1.63 million) raised from its ongoing ICO, with still less than a week remaining. SunContract is a renewable energy marketplace developed by power specialists and IT professionals. The platform balances its service to incorporate market demands and blockchain technologies within the energy distribution industry.

[Note: This is a press release.]


Solar energy trading platform

The SunContract Energy Pool is a P2P marketplace that facilitates the exchange of clean energy directly between customers without the involvement of intermediaries, through an automatic digital bidding process made possible through Ethereum smart contracts.

The meteoric rise in the cost of traditional energy is exacerbated largely by sizable investments in infrastructure and costs relating to transmission, taxes, and losses through inefficient work practices. This trend and a growing availability of renewables have resulted in an increased development of the clean energy sector, which has led to a significant increase in the production efficiency.

Also, there is often considerable excess energy, produced from non-conventional power generation units, which is controlled by small and large private individuals or companies.

SunContract aims to reappropriate this excess energy by enabling the producers to sell it through the company’s open P2P market to all different types of consumers, without an intermediary or a trusted third party.

The use of blockchain technology in energy market not only helps automate most of the processes but also acts as an energy fraud and theft prevention mechanism. The transparency, immutability, and security of the Ethereum blockchain makes it easier to track energy distribution and usage, as well as prevent meter tampering, power theft, and other fraudulent activities.

SunContract focuses on the efficient use of clean energy, in a bid to reduce the company’s carbon footprint as much as possible. The company manages this by guaranteeing that all excess clean energy is stored correctly and eventually utilized properly. The company’s project started in 2016 but had already planned out its entire roadmap, explained in the whitepaper.

SunContract ICO

SunContract’s ICO has been successful so far and will continue for few more days. Investors can participate in the initiative by purchasing SNC tokens with Ethereum on the company’s ICO page. SunContract’s native SNC tokens act as the main unit of exchange on the platform.

Investors will receive 10,000 SNC tokens per every ETH, and with the recent increase in energy-backed tokens, the value of SNC is likely to rise when it hits the markets. The SunContract ICO has already surpassed the first milestone of 5000 ETH and now looks to hit 10,000 ETH. Interested individuals can participate in the ICO via the website.


Images courtesy of SunContract

The post Blockchain Solar Energy Trading Platform SunContract Raises over 8200 ETH in Ongoing ICO appeared first on Bitcoinist.com.