July 30, 2026

Capitalizations Index – B ∞/21M

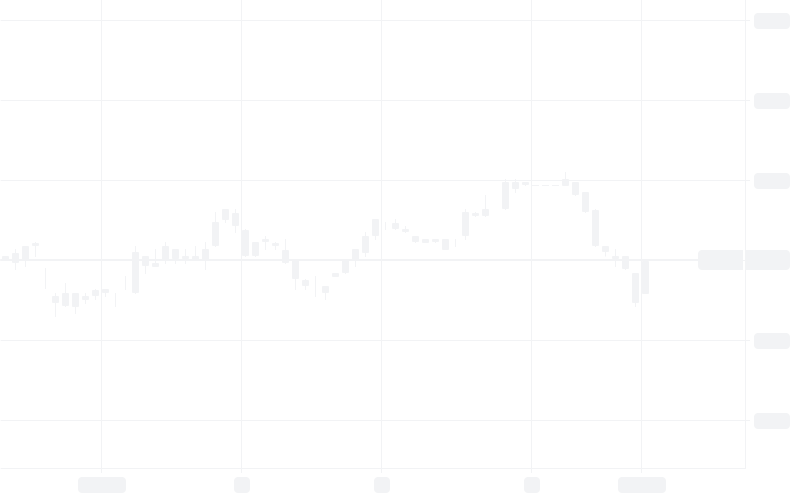
Bitcoin Weekly Chart

Bitcoin weekly chart

Bitcoin Weekly Chart

Proceed with caution!

I see a lot of bullish sentiment starting to emerge which already signs of warning. In addition we are given some clear clues that prices might decline in the coming weeks.

Analysis:

– Price has been increasing slowly while volume is dropping.
– Price is at strong resistance.
Stochastic RSI is at the same level as when bitcoin was at $20.000 and looks ready to crossover bearish .

Also most of the Alts that have been doing well seem to be at strong resistance, with this all colliding I’m expecting a pull back.

Published at Sat, 30 Mar 2019 12:18:18 +0000

Previous Article

The Ultimate Irony of Crypto Trading

Next Article

Cryptocurrency-backed Palladium to be tabled by Russian billionaire |

You might be interested in …

Bitcoin Core 0.17.1 Released

bitcoin Core 0.17.1 Released bitcoin Core version 0.17.1 is now available for download containing several bug fixes and minor improvements. For a complete list of changes, please see the release notes. If have any questions, […]