October 12, 2026

Capitalizations Index – B ∞/21M

Bitcoin: Turn Down for What?

Bitcoin: turn down for what?

Bitcoin: Turn Down for What?

Bitcoin: turn down for what?

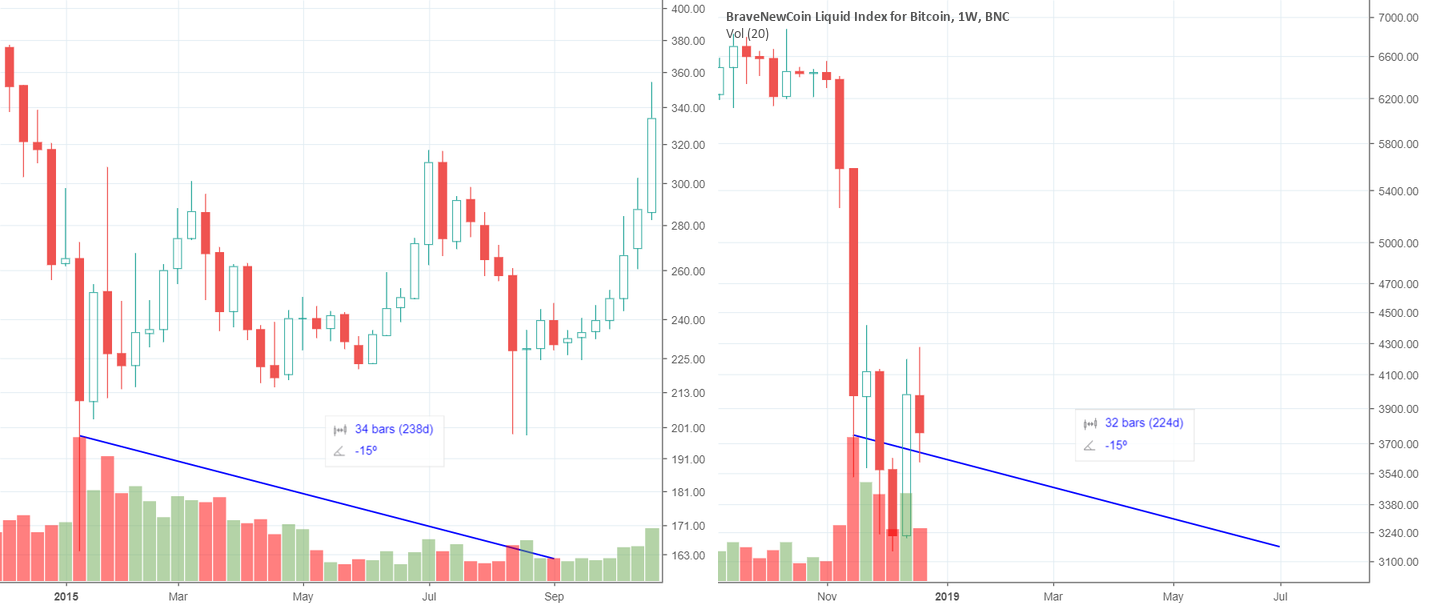
I’m fortunate to have a boss who majored & mastered in finance and thesis on use of lagging indicators such as RSI , MACD , Stoch etc. and day trader of 20 years. Yesterday, we had a discussion about TA in general. He said the most important factors are volume and patterns. I hadn’t really considered regular time volume as important before so I decided to compare the volume during the previous (2015) bear market bottom with the present (assumed) bear market bottom.

As we can see, logically the selling (red) volume decreases as the sellers dry up. Then the price begins to get some traction and start another glorious bull run. I have copied the % of the angle of the decrease in volume from 2015 just as a template, the point is: the volume decreases. Also, IF the bottom HAS been made, it was 1 month (last bear was 13 months so 1 month = 7.69%) shorter than the previous bear market so I have also reduced the length of the estimated bottom accordingly.

This is NOT meant to be a precise prediction or financial advice, of course of course of course. Just an interesting observation.

I think/hope this makes sense, if not, leave comments and discussions below.

Happy new year to all!

Published at Sun, 30 Dec 2018 03:14:28 +0000

Previous Article

GT Labs Chief of Staff, Manager

Next Article

1 in 7 Chinese Have Invested in Cryptocurrency 

You might be interested in …

Heuristics are not an investment strategy

News Heuristics are not an investment strategy A heuristic strategy for problem-solving might otherwise be described as a ‘rule of thumb’ or ‘best guess’ approach. It’s fine for some things — like pumping up your tyres or […]

Gold Market Charts – June 2017

bullionstar.com / 28 Jun 2017

This monthly series analyses recent developments in the world’s largest physical gold markets such as India, China, Russia and Switzerland and features charts as diverse as Swiss gold imports and exports, Russian Federation gold reserves, Shanghai Gold Exchange physical gold withdrawals, and COMEX gold futures vault inventories. The featured charts have been created by the GOLD CHARTS R US market chart website.

Shanghai Gold Exchange (SGE) – Gold Withdrawals

Shanghai Gold Exchange (SGE) gold withdrawal data for the month of May was reported by the Exchange to have reached 138 tonnes. Note, these gold withdrawal figures refer to actual withdrawals of physical gold bars from the Exchange’s vast vault network, and are a suitable proxy for estimating Chinese wholesale gold demand.

READ MORE

The post Gold Market Charts – June 2017 appeared first on Silver For The People.

Indacoin adds the ability to sell cryptocurrency via Android

CryptoNinjas Indacoin adds the ability to sell cryptocurrency via Android Indacoin, an app which allows users to buy BTC, ETH, LTC, XRP, DASH, WAVES and other coins via credit card today announced new functionality for Android […]