
Photo: Shutterstock
Key Highlights:
- The confluence level was broken by the bulls on the daily chart;
- the bulls may take over the market;
- the downtrend may continue in case the $68 support level break.
BSV/USD Price Long-term Trend: Bullish
Resistance levels: $85, $100, $114
Support levels: $68, $54, $41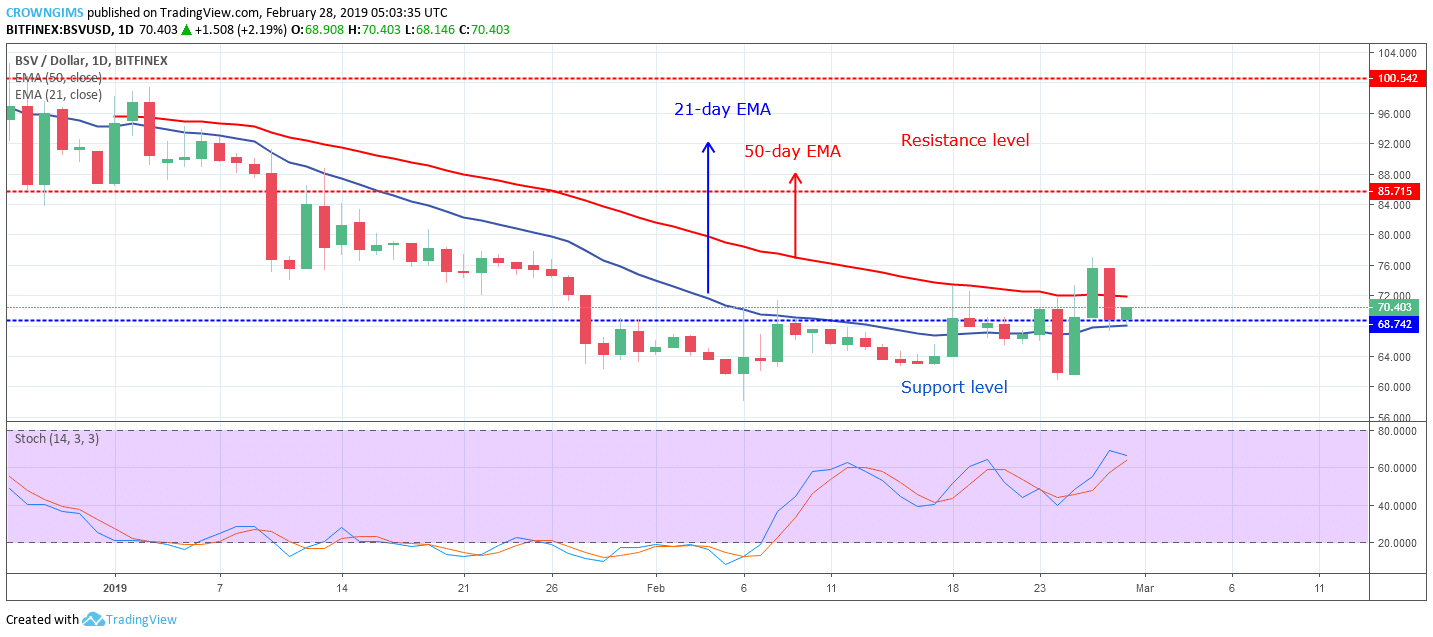 bitcoin SV/USD is bullish on the Long–term. Last week, bitcoin SV price was range-bound within $68 resistant level and $54 support level. A kind of confluence was noticed at $68 price level. A piercing line candle pattern formed on February 25 indicates the increase in the bullish momentum and it is also a bottom reversal signal; this made the bulls to break up the former resistance level of $68 and also the two dynamic resistance level.
The coin is now exposed to the resistance level of $85. It is currently carrying out retest.
The BSV is already placed in between the two EMAs, in which the 50-day EMA is above the 21-day EMA. The Stochastic Oscillator period 14 is at 60 levels with the signal lines pointing up to indicate that the bullish momentum may increase and it is also a buy signal.
The bullish trend continues as long as the Bulls maintain or increase their pressure and the coin may have its resistance at $85 price level. In case the support level does not hold, the coin will find its low at $54 price level.
BSV/USD Price Medium-term Trend: Bullish
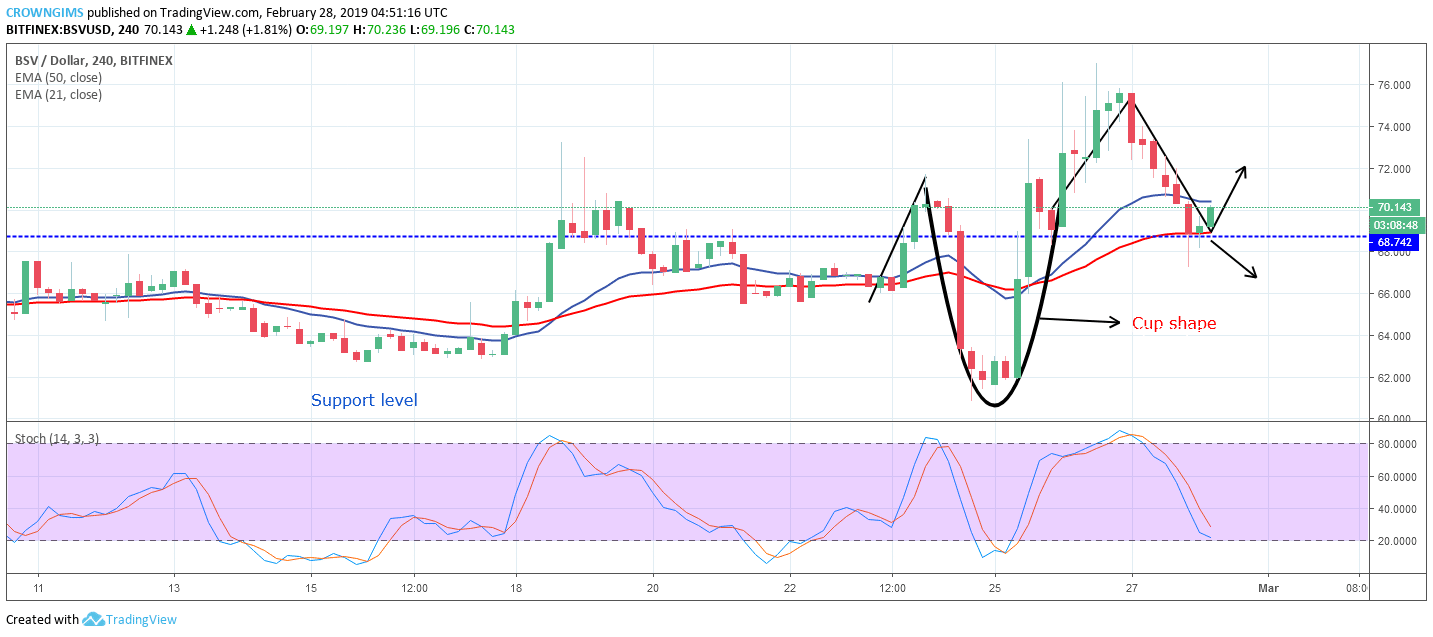
 bitcoin SV/USD continues its uptrend movement on the medium-term outlook. A cup shape with handle candle pattern was formed on the 4-Hour chart. The bearish trend pushed the coin down to $61 mark and the bulls opposed the further downtrend and gained enough pressure that pushed the coin up and broke up the $68 price level and rally towards $85 but unable to reach the target. The bears rejected further increase in bitcoin SV price.
The bitcoin SV is on the $68 support level, in case the bearish candle break down the level and close below it, the coin will decline further towards $54 price level, if not, then the crypto will bounce and rally to the north. Meanwhile, BSV is in between the 21-day EMA and the 50-day EMA and the Stochastic Oscillator is at 20 levels (oversold level) gradually bending up which indicates buy signal.
Published at Thu, 28 Feb 2019 07:18:02 +0000