- bitcoin price declined recently and traded below the $3,725 support against the US Dollar.
- There is a short term breakout pattern forming with resistance near $3,650 on the 4-hours chart of the BTC/USD pair (data feed from Kraken).
- The pair may soon make the next move either above $3,650 or below $3,550 in the near term.
bitcoin price faced an increased selling pressure below $3,700 against the US Dollar. BTC/USD is aligned for the next break either bullish above $3,650 or bearish below $3,550.
bitcoin Price Analysis
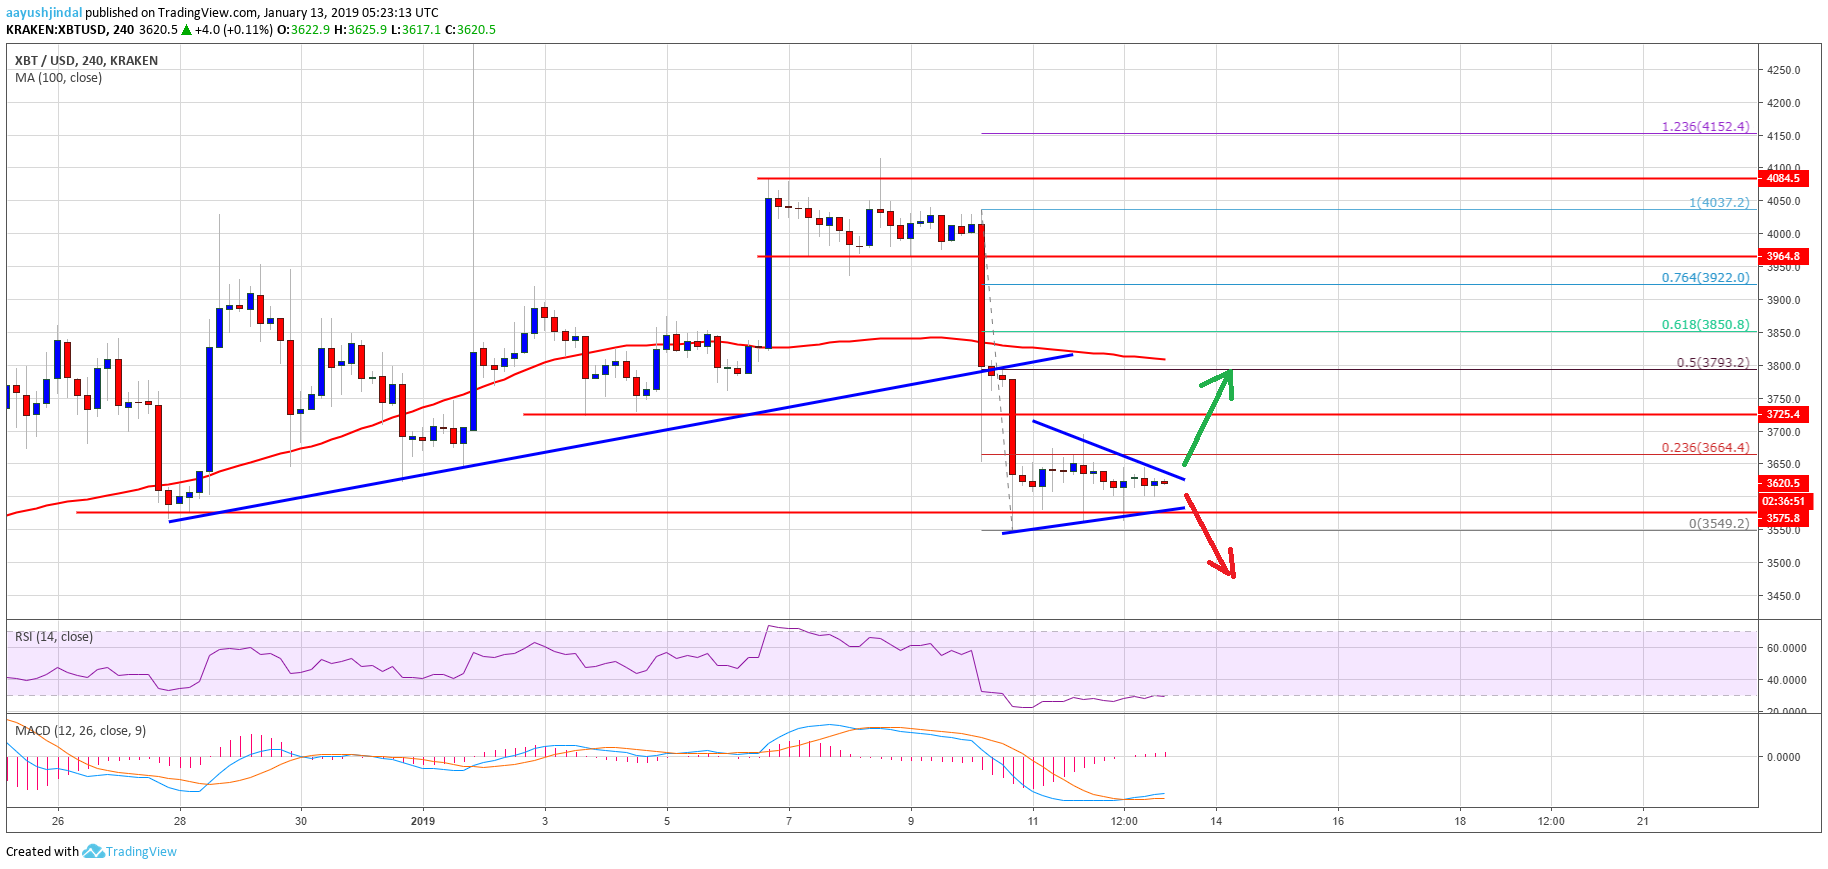
This past week, bitcoin BTCUSD price started a from the $4,037 swing high against the US Dollar. The BTC/USD pair declined heavily and broke the $4,000, $3,800, $3,725 and $3,650 support levels. The decline was nasty as there was a close below the $3,725 level and the 100 simple moving average (4-hours). It traded close to the $3,550 support area and later started consolidating losses. An initial resistance on the upside is near the $3,650 and $3,660 levels.
More importantly, there is a short term breakout pattern forming with resistance near $3,650 on the 4-hours chart of the BTC/USD pair. Therefore, the pair seems to be preparing the next break either above $3,650 or below $3,550 in the near term. A break above the $3,650 level may push the price towards the $3,660. It represents the 23.6% Fib retracement level of the last drop from the $4,037 high to $3,549 low. A successful close above the $3,660 and $3,665 level may towards $3,725. The main resistance is near the $3,790 level. It coincides with the 50% Fib retracement level of the last drop from the $4,037 high to $3,549 low.
Looking at the , BTC price could even break the $3,550 support and extend losses. In the stated bearish scenario, the price may extend losses below $3,500 and $3,400.
Technical indicators
4-hours MACD – The MACD for BTC/USD is slowly moving in the bullish zone, with lack of strength.
4-hours RSI (Relative Strength Index) – The RSI for BTC/USD is currently near the 30 level, with a bullish angle.
Major Support Level – $3,550
Major Resistance Level – $3,660
Published at Sun, 13 Jan 2019 06:00:13 +0000
![Bitfinex planning initial exchange offering [ieo]; expects to raise $1 billion in tether [usdt]](https://ohiobitcoin.com/storage/2019/05/fYUe2z.jpg "Bitfinex planning initial exchange offering [ieo]; expects to raise $1 billion in tether [usdt]")

