Key Points
- bitcoin price stayed above the $8,000 support level and recovered against the US Dollar.
- There is a monster bearish trend line forming with resistance at $8,300 on the 4-hours chart of the BTC/USD pair (data feed from Kraken).
- The pair has to move above the trend line and settle above $8,300-8,400 for more gains in the near term.
bitcoin price is currently testing a major resistance near $8,400 against the US Dollar. BTC/USD could accelerate higher once there is a proper close above $8,400.
bitcoin Price Upside Barrier
This past week, there were further downsides in bitcoin price against the US Dollar. The price moved down and broke the $8,200 support level. There was even a spike below the $8,000 pivot level before a low was formed at $7,940. Later, the price started an upside correction and succeeded in moving above the $8,000 pivot level.
There was also break above the 23.6% Fib retracement level of the last drop from the $8,884 high to $7,940 low. However, there is a crucial barrier on the upside near $8,300-8,400, which is preventing further gains. More importantly, there is a monster bearish trend line forming with resistance at $8,300 on the 4-hours chart of the BTC/USD pair. Furthermore, the 50% Fib retracement level of the from the $8,884 high to $7,940 low is also close to the $8,400 level. Therefore, a break and close above the $8,400 resistance is needed for more gains in BTC. The next resistance above $8,400 sits near the $8,800 pivot level.
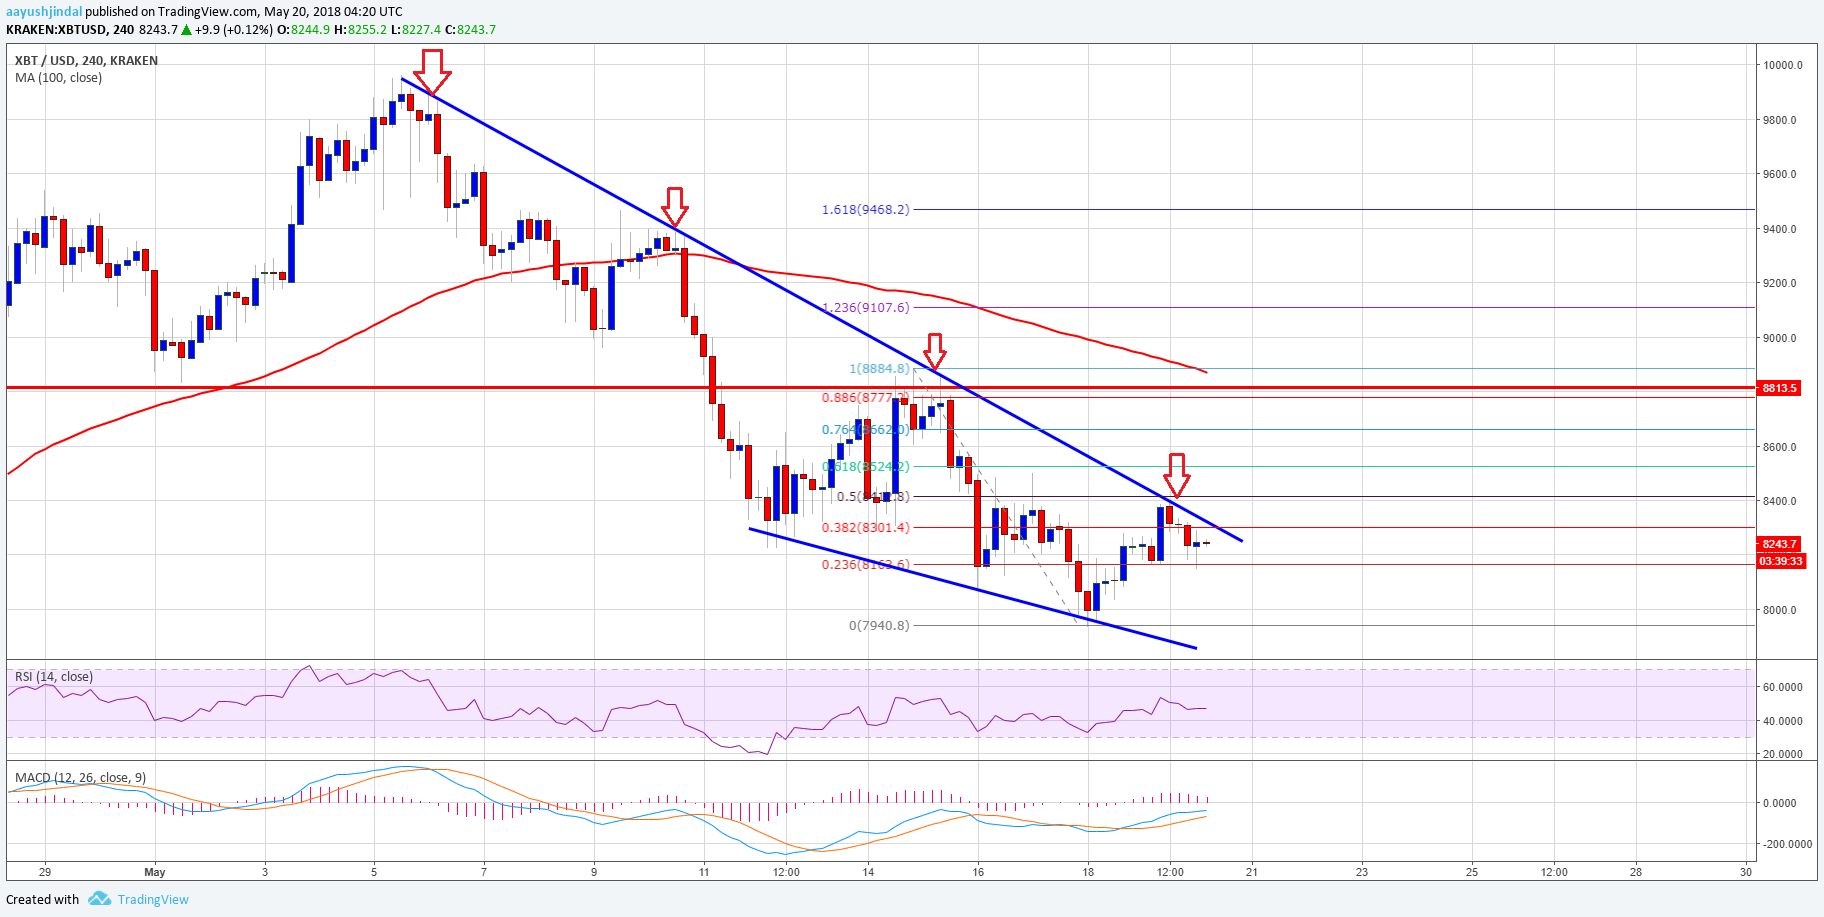
Looking at the , the price seems to be approaching a key break above $8,400. If buyers fail to push the price above the mentioned resistance, there could be a downside reaction back towards $8,000.
Looking at the technical indicators:
4-hours MACD – The MACD for BTC/USD is currently stable in the bullish zone.
4-hours RSI (Relative Strength Index) – The RSI is currently just below the 50 level.
Major Support Level – $8,000
Major Resistance Level – $8,400
Published at Sun, 20 May 2018 06:28:13 +0000
Analysis