Key Points
- bitcoin price made a nice upside move and traded above $9,000 and $10,000 against the US Dollar.
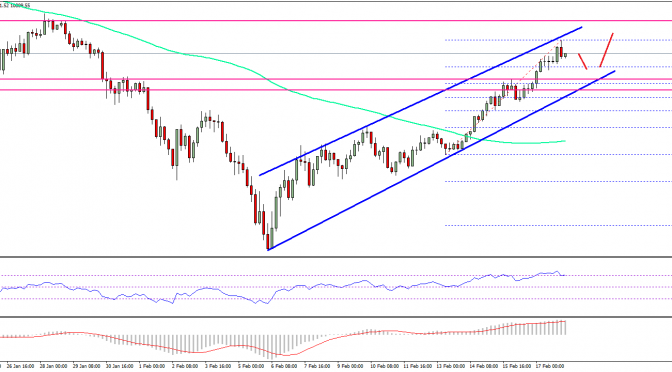
- There is a major ascending channel forming with current support at $10,150 on the 4-hours chart of the BTC/USD pair (data feed from SimpleFX).
- The pair may continue to rise and the next major resistances are at $11,600 and $12,000.
bitcoin price showing many bullish signs above $10,000 against the US Dollar. BTC/USD may correct a few points in the short term, but it remains supported above $10,150.
bitcoin Price Support and Trend
This past week, as bitcoin price succeeded in breaking the $9,000 resistance area against the US Dollar. The upside move was strong and later the price even moved above the $10,000 level to register decent gains. The price is now comfortably placed well above the $10,000 level and the 100 simple moving average (4-hours). The recent high formed was at $11,160 from where the price started correcting lower.
An initial support is around the 23.6% Fib retracement level of the last wave from the $8,250 low to $11,160 high. More importantly, there is a major ascending channel forming with current support at $10,150 on the 4-hours chart of the BTC/USD pair. The channel support at $10,150 is since the same level was a resistance earlier and now it is a good buy zone. Moreover, the 38.2% Fib retracement level of the last wave from the $8,250 low to $11,160 high is near $10,040.
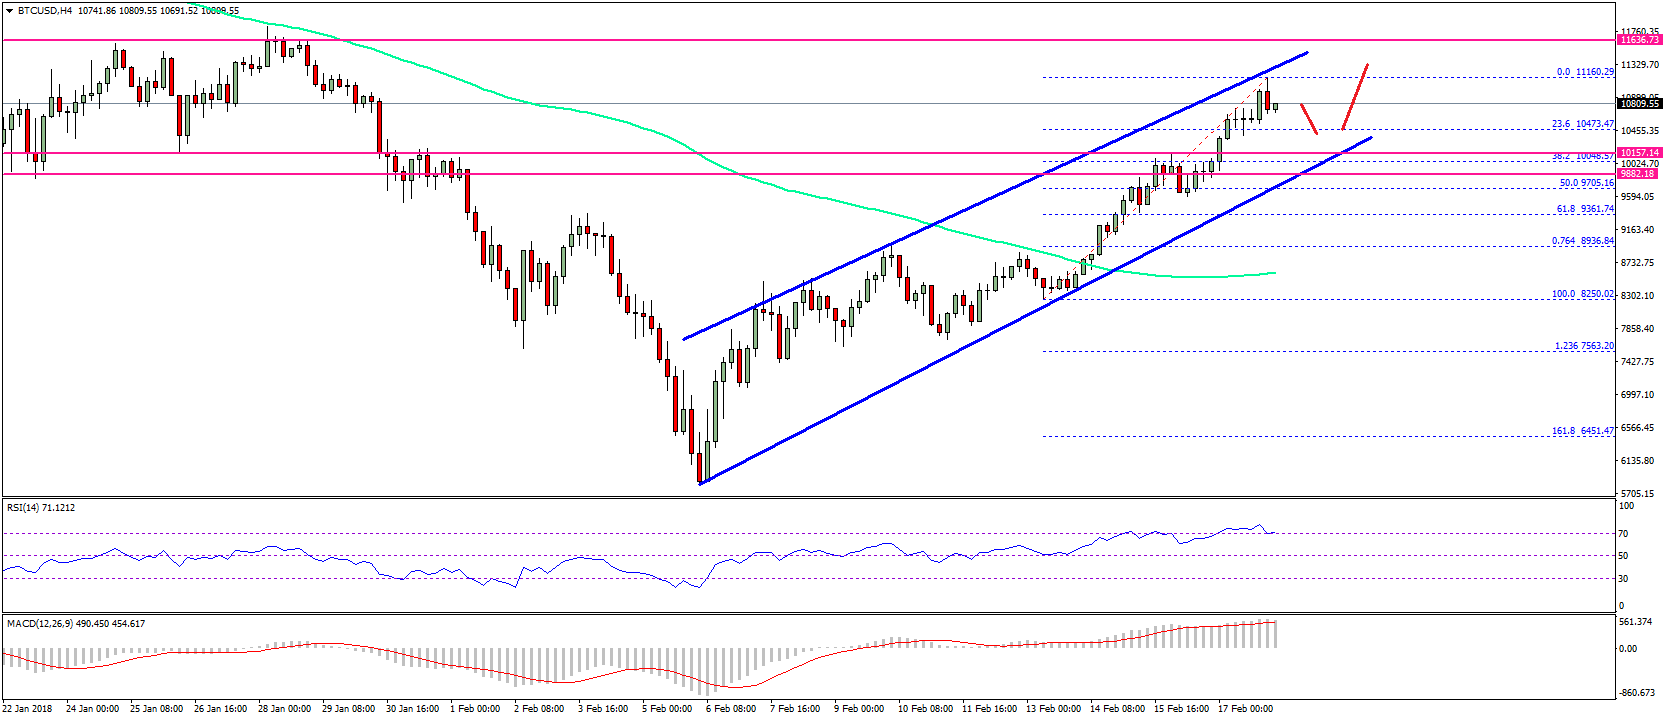
Therefore, if the price corrects lower from the current levels, it could find support near $10,000. On the upside, the price has to break the $11,160 level to gain momentum towards $11,600 and $12,000.
Looking at the technical indicators:
4-hours MACD – The MACD for BTC/USD is placed strongly in the bullish zone.
4-hours RSI (Relative Strength Index) – The RSI is currently near the overbought levels, with no major downside sign.
Major Support Level – $10,000
Major Resistance Level – $11,600
Charts courtesy –
Published at Sun, 18 Feb 2018 07:28:46 +0000
Analysis