Key Points
bitcoin price remains in a bearish zone below the $3,400 and $3,500 resistances against the US Dollar.
This week’s followed key bearish trend line is in place with resistance at $3,440 on the hourly chart of the BTC/USD pair (data feed from Kraken).
The price remains at a risk of more losses if there is no break above $3,440 and $3,500.
bitcoin price is slowly extending losses below $3,400 against the US Dollar. BTC could accelerate losses if buyers continue to struggle near $3,440-3,500.
bitcoin Price Analysis
During the past few hours, there were below $3,500 in bitcoin price against the US Dollar. The BTC/USD pair recently settled below the $3,400 level and the 100 hourly simple moving average. A new intraday low was formed at $3,295 and later the price corrected a few points higher. On the upside, an initial resistance is near the 23.6% Fib retracement level of the recent slide from the $3,635 high to $3,295 low.
However, the first major resistance is near $3,420 and the 100 hourly SMA. More importantly, this week’s followed key bearish trend line is in place with resistance at $3,440 on the hourly chart of the BTC/USD pair. Above the trend line, there is a near $3,475. It coincides with the previous highs and the 50% Fib retracement level of the recent slide. Therefore, a successful break above $3,440 and $3,475 is needed for a recovery above $3,500. On the other hand, if buyers continues to fail near $3,475 or the trend line, there could be a downside reaction.
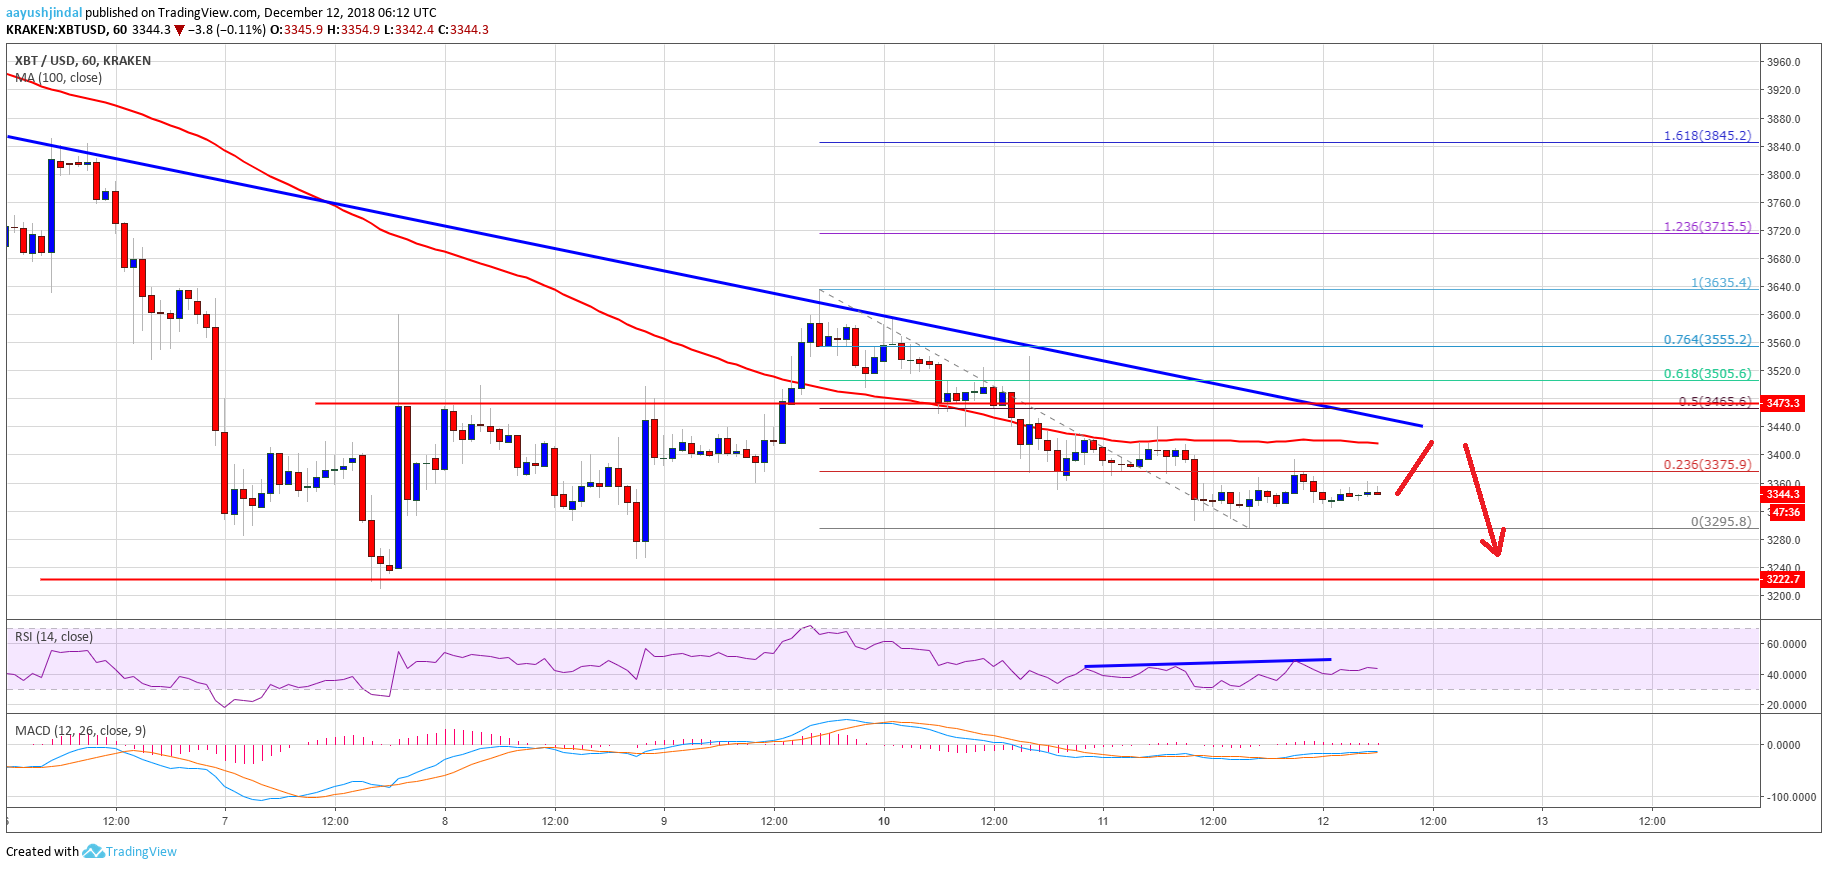
Looking at the , bitcoin price is likely to extend losses below the $3,295 low or $3,250 if there is no break above $3,500. Further below $3,250, the price may even slide towards $3,020.
Looking at the technical indicators:
Hourly MACD – The MACD for BTC/USD is slightly in the bullish zone.
Hourly RSI (Relative Strength Index) – The RSI is showing a minor bullish divergence above 40.
Major Support Level – $3,295
Major Resistance Level – $3,475
The post appeared first on .