Key Points
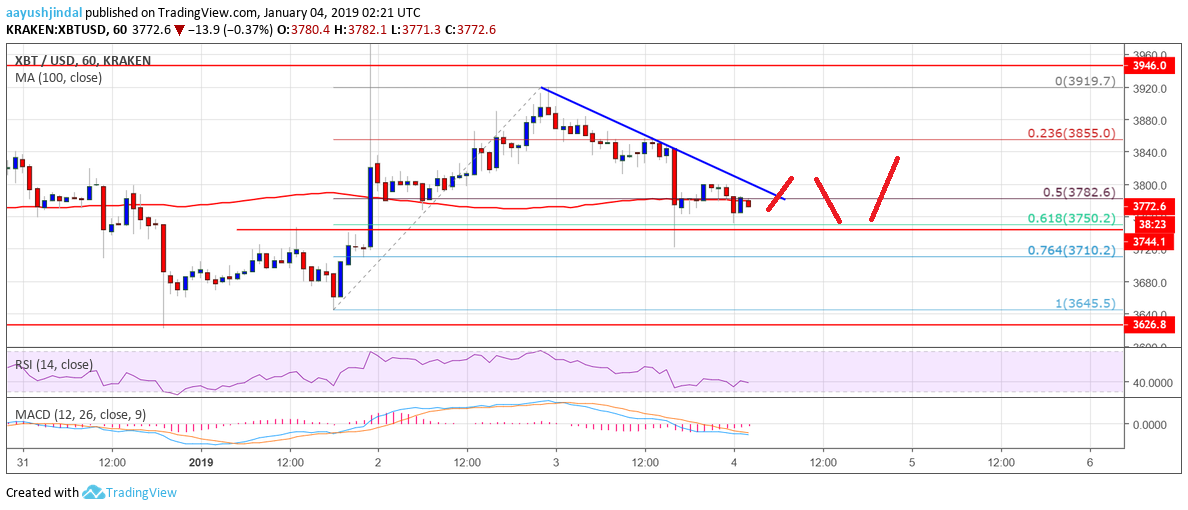
- bitcoin price recently traded as high as $3,919 and later started a downside correction against the US Dollar.
- There is a major bearish trend line formed with resistance at $3,800 on the hourly chart of the BTC/USD pair (data feed from Kraken).
- The price must stay above the $3,740 support level to bounce back in the near term.
bitcoin price started a downside correction towards $3,700 against the US Dollar. BTC could climb higher once again if buyers continue to defend $3,740.
bitcoin Price Analysis
Yesterday, we saw a above the $3,800 resistance in bitcoin [BTC] price against the US Dollar. The BTC/USD pair even broke the $3,900 resistance and traded towards the $3,920 level. A high was formed at $3,919 and later the price started a downside correction. It declined below the $3,850 support to move into a short term bearish zone. The price also declined below the 50% Fib retracement level of the last wave from the $3,645 low to $3,919 high.
Sellers pushed the price below the $3,800 level and there was a test of the $3,740 support. Buyers protected the 61.8% Fib retracement level of the last wave from the $3,645 low to $3,919 high. At the moment, the price is above the $3,740 support and the 100 hourly simple moving average. On the upside, there is a strong resistance formed near the $3,800 level. Moreover, there is a major bearish trend line formed with resistance at $3,800 on the hourly chart of the BTC/USD pair.
Looking at the , bitcoin [BTC] price must break the trend line and the $3,840 resistance level to climb higher once again. On the downside, the main support is at $3,740, below which the price may decline further towards $3,650.
Looking at the technical indicators:
Hourly MACD – The MACD for BTC/USD is slightly placed in the bearish zone.
Hourly RSI (Relative Strength Index) – The RSI is well below the 50 level.
Major Support Level – $3,740
Major Resistance Level – $3,840
Published at Fri, 04 Jan 2019 05:00:24 +0000