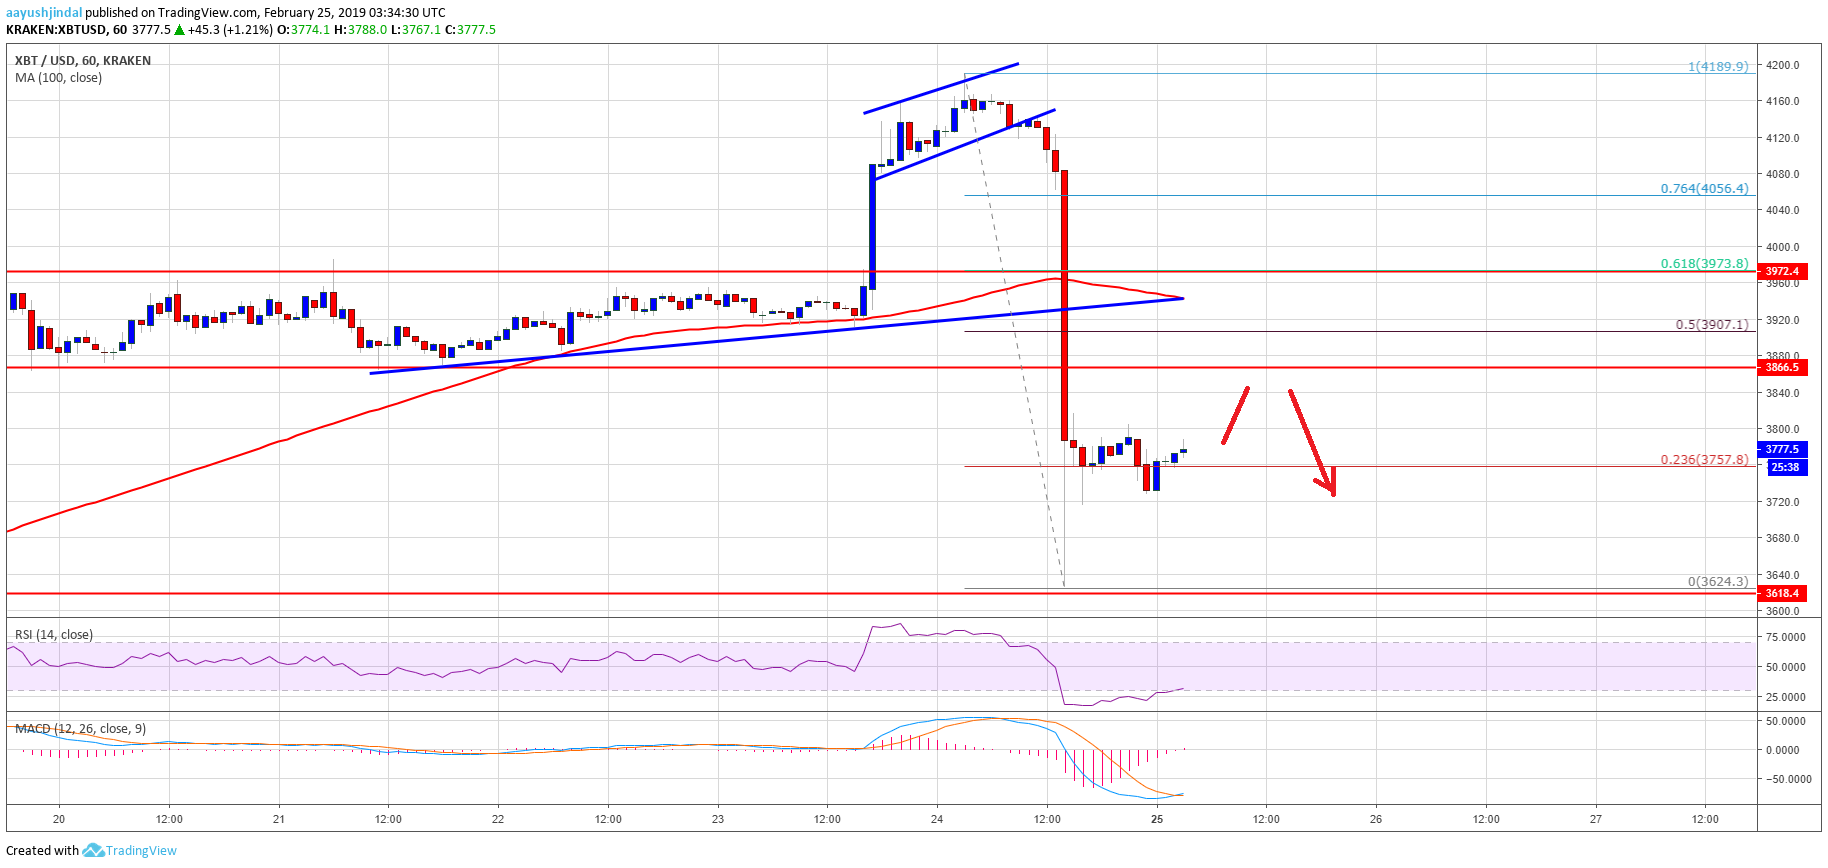
- bitcoin price found a strong resistance near the $4,190 level and later declined against the US Dollar.
- The price declined sharply and broke the $4,000 and $3,900 support levels.
- There was a break below a major bullish trend line with support at $3,940 on the hourly chart of the BTC/USD pair (data feed from Kraken).
- The pair traded towards the $3,600 support level and it is currently correcting higher
price nosedived below the $3,900 support against the US Dollar. bears are in control and it seems like recoveries could face a strong resistance near $3,900 and $4,000.
bitcoin Price Analysis
In the weekly analysis, we saw a above the $4,000 resistance in price against the US Dollar. The /USD pair even broke the $4,100 resistance area. It traded to a new monthly high at $4,189, where sellers emerged. It seems like the price was rejected near the $4,190 resistance. As a result, there was a sharp bearish reaction below the $4,150 and $4,100 support levels. Sellers gained pace and pushed the price below the key $4,000 support level.
During the decline, there was a break below a major bullish trend line with support at $3,940 on the hourly chart of the /USD pair. The pair even settled below the $3,900 support and the 100 hourly simple moving average. Finally, there was a break below the $3,700 support and the price traded towards $3,600. A new weekly low was formed at $3,624 and later the price corrected higher. It broke the 23.6% Fib retracement level of the recent decline from the $4,189 high to $3,624 low.
The current price action is bearish and it seems like . However, the main resistance is near the $3,900 level. Besides, the 50% Fib retracement level of the recent decline from the $4,189 high to $3,624 low is near the $3,910 level. Above $3,900, the price could face resistance near $3,950 and the 100 hourly SMA. More importantly, a break above the main $4,000 hurdle won’t be easy for buyers.
Looking at the , price made a sharp U-turn below the $4,000 and $3,900 support levels. It could correct higher in the short term, but the previous supports at $3,860 and $3,900 might prevent gains. On the downside, an initial support is at $3,680, below which the price may decline below $3,600.
Technical indicators
Hourly MACD – The MACD could move back in the bullish zone.
Hourly RSI (Relative Strength Index) – The RSI for /USD is currently recovering from 20 and it could test 45.
Major Support Level – $3,680 followed by $3,600.
Major Resistance Level – $3,860, $3,900 and 3,950.
Published at Mon, 25 Feb 2019 06:16:41 +0000