- bitcoin price is consolidating losses above the $3,560 support area against the US Dollar.
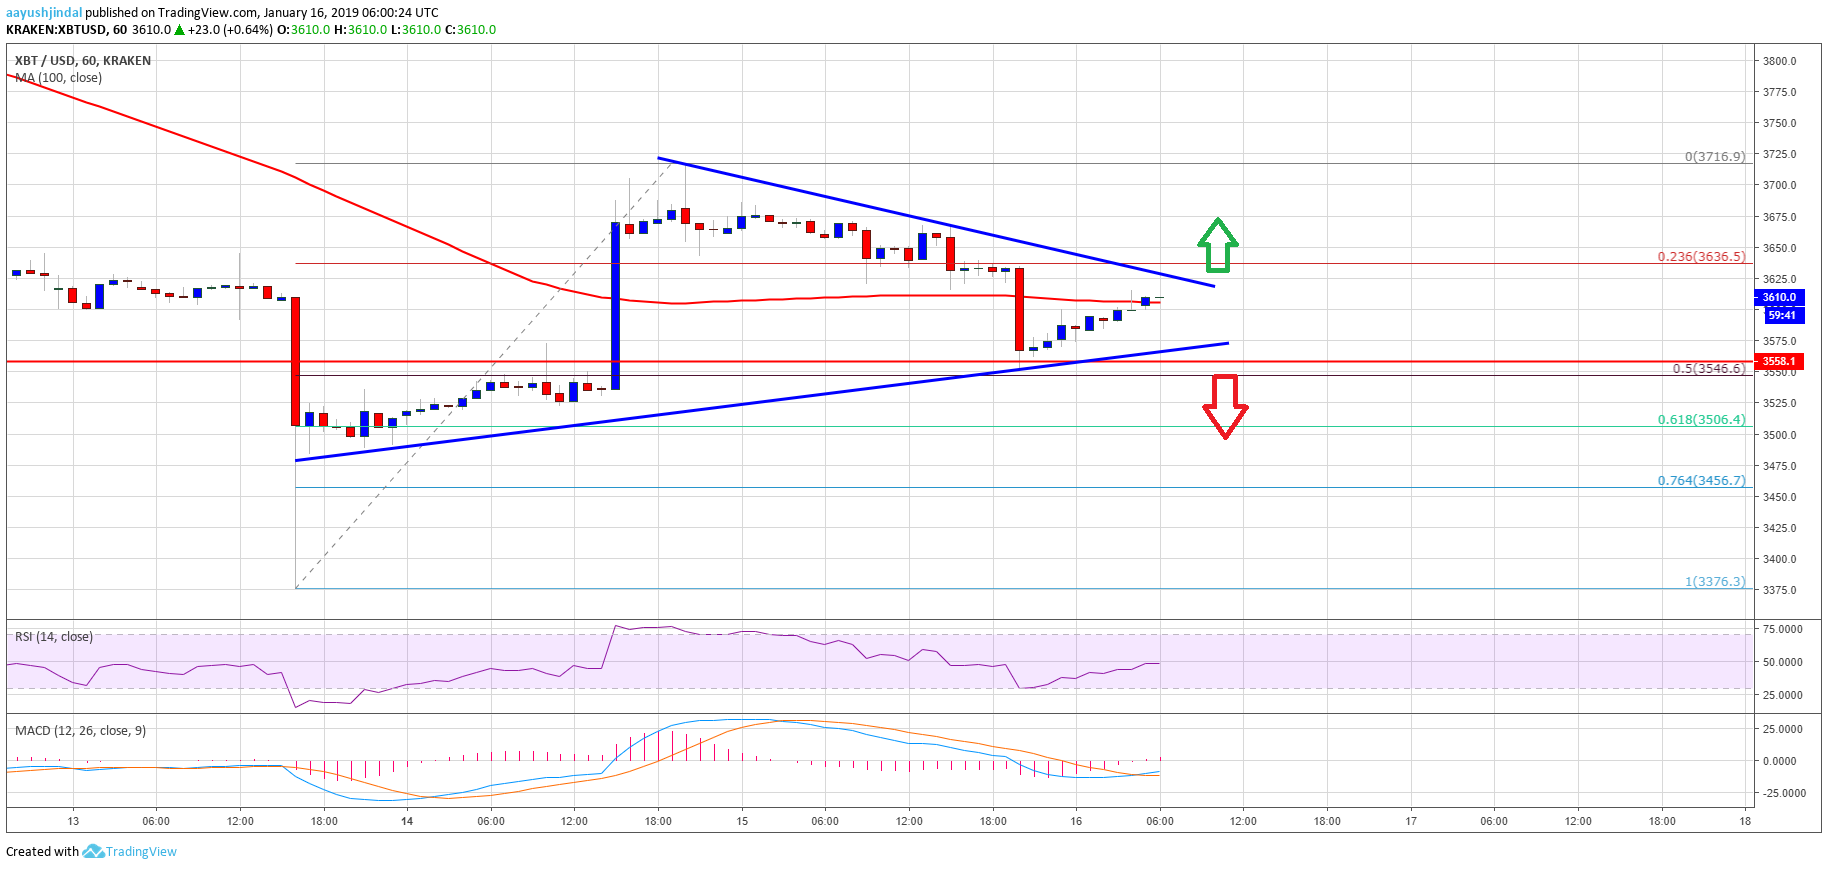
- There is a short term contracting triangle formed with resistance at $3,625 on the hourly chart of the BTC/USD pair (data feed from Kraken).
- The price may soon make the next move either above $3,650 or below $3,540 in the near term.
bitcoin price is preparing for the next key break above $3,650 against the US Dollar. A close above $3,650 could trigger bullish moves towards $3,720 and $3,800.
bitcoin Price Analysis
After trading above the $3,700 level, bitcoin [BTC] price faced renewed selling pressure against the US Dollar. More importantly, sparked a downward move below $3,650 in the BTC/USD pair. It declined below the $3,620 support and the 100 hourly simple moving average. Besides, there was a break below the 23.6% Fib retracement level of the last wave from the $3,376 low to $3,716 high. The price even traded below the $3,600 support, but the $3,560 pivot acted as a solid support.
Additionally, the 50% Fib retracement level of the last wave from the $3,376 low to $3,716 high also acted as a support. At the outset, the price is currently holding the $3,560 support, with range moves. It seems like there is a short term contracting triangle formed with resistance at $3,625 on the hourly chart of the BTC/USD pair. Should there be above the $3,650 resistance, the price may climb towards the $3,700 and $3,750 levels. On the other hand, a downside break below $3,560 and $3,540 might trigger bearish moves. The next key supports are near $3,500 and $3,455.
Looking at the , bitcoin [BTC] price is clearly consolidating and preparing for the next move either above $3,650 or below $3,540. The current price action is positive, but a convincing break above $3,650 is must for a decent upward move. If not, it could drop to $3,500 or $3,455.
Technical indicators
Hourly MACD – The MACD for BTC/USD is about to move back in the bullish zone.
Hourly RSI (Relative Strength Index) – The RSI for BTC/USD recovered nicely and it may soon break the 50 level.
Major Support Level – $3,540
Major Resistance Level – $3,650
Published at Wed, 16 Jan 2019 06:40:52 +0000