November 4, 2026

Capitalizations Index – B ∞/21M

Bitcoin Price Retesting Mean Levels Per Behavioral Finance – Bullish?

Bitcoin price retesting mean levels per behavioral finance – bullish?

Bitcoin Price Retesting Mean Levels Per Behavioral Finance – Bullish?

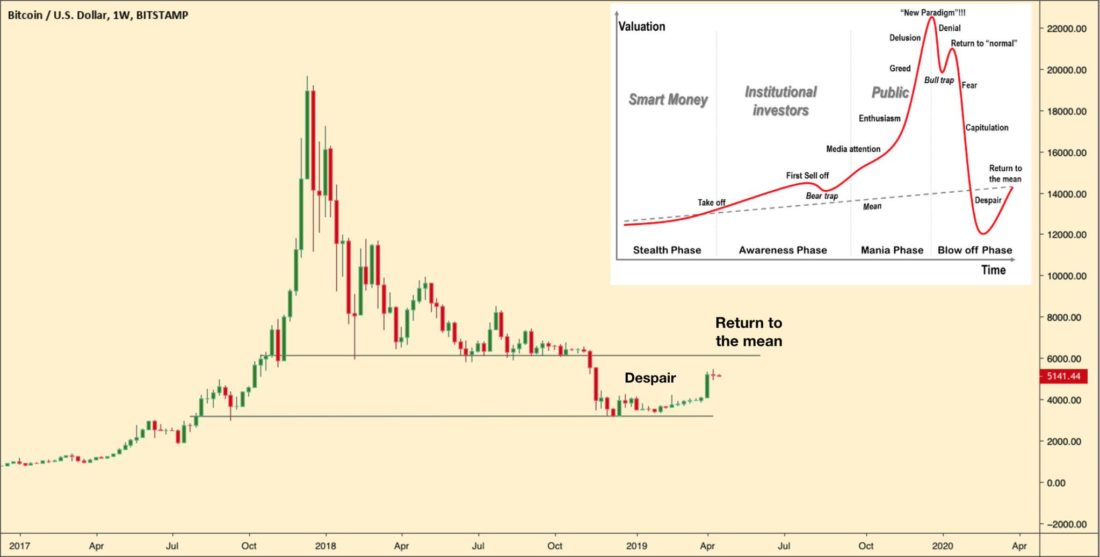
The previous bitcoin bubble has popped, and a new one is already forming, at least according to the Crypto Monk.

The hugely-followed bitcoin and altcoin trader today compared bitcoin’s price performance to the classic lifecycle of a stock bubble. Just like its traditional counterparts, the bitcoin price bubble too had begun with a stealth phase, when the new money entered the market. It then penetrated the awareness phase, in which more investors started taking notice of bitcoin’s price rise.

The bitcoin bubble then moved to the mania phase, supported by mainstream media coverages. Finally, it started losing its size when investors started exiting the bitcoin market at interim profits. And the bubble probably died when bitcoin price touched $3,100 as its s0-called bottom. That was the Blow Off phase.

The bitcoin’s interim boom-and-bust action is reminiscent of many similar bubbles in the mainstream market. The top three stages, for instance, look a lot like October 1929, February 2000, and October 2007 stock bubbles. All these bubbles, nevertheless, have different characteristics. What unites them, in the end, is their ability to recover back and form another price bubble whether it is 1990s dotcom bubble or 2008’s housing market bubble.

The Mean Curve

The mean curve in the bubble cycle signifies a tipping point that separates an asset’s average value over a set of specific periods. One can also consider them as a break-even value of an asset. If the price is above it, it’s overbought. And if it is below the mean, then it’s oversold. As of now, the bitcoin price to attempting to jump above the same curve.
Bitcoin, bitcoin price

bitcoin Price Testing Mean Line for Next Bubble Formation | Source: The Crypto Monk

From the look of the chart, the bitcoin bubble has not fully popped. There is still a reasonable probability of the asset remaining inside the despair phase, dropping towards deeper targets. The worst-case scenario for bitcoin is a complete breakdown. But the possibility of such an event is negligible given the underlying growth of the bitcoin industry. Meanwhile, the first scenario is bitcoin jumping above the mean level – which coincides with the $6,000-resistance level. Such an action, according to the Crypto Monk, would confirm a new bubble formation.

Luckily, bitcoin has adequate fundamentals to push itself above the mean level. The April 2 pump has improved buying sentiments in the bitcoin market – and almost all the medium-term indicators are pointing at an extended bullish momentum. According to Alex Krüger, a celebrated cryptocurrency analyst, investors are buying dips at fresher higher lows with a higher degree of confidence.

“Investors (rather than traders) should be looking at fundamentals and the bigger picture,” stated Krüger. “Intraday moves, barring extreme occasions such as the recent breakout, are noise for investors. You will not catch the bottom.”

Published at Sun, 21 Apr 2019 13:00:59 +0000

Previous Article

Binance Chain’s ‘decentralization’ questioned by Bitcoin enthusiast; calls Binance DEX just an app

Next Article

Bitcoin Price Volatility Soars 200% in April

You might be interested in …

Scientists Use Quantum-Based Accelerometer To Locate Objects

Scientists Use Quantum-Based Accelerometer To Locate Objects Image source: YouTube Video Screenshot When it comes to locating objects in the world, GPS has always been an essential part of every smart device. People use portable […]

Ether Price Analysis: Price Movement Shows Strong Market Value

Ether Price Analysis

What the heck is happening in the crypto world?  Is Ethereum finally dead?  Is ETH taking its last breaths?

Not likey. In fact, the recent pullback on the ETH-USD market is probably one of the best and healthiest things investors and traders could have asked for. Given ether’s 300% price rise in just over a month, this pullback has a left many traders and investors bullish on the ETH-USD market.

On a macro-scale, we can see ETH-USD had a very nice, textbook market correction along the 50% Fibonacci Retracement Line (shown in brown).  This test of the 50% line was immediately rejected and is illustrated by the massive spike in volume (shown in blue).  

For healthy, growing markets 50% retracements are a very common occurrence, and the market response to the retracement can be viewed as a sort of litmus test for the strength of a market (i.e. a positive rejection of the 50% line with upward price action tends to indicate the market still desires higher prices, and a negative move from the 50% line will typically indicate the market is still extended and thus overvalued).

ETHUSD Macro View.png

Figure 1:  ETHUSD, GDAX, 12HR Candles

Looking at the micro-trend, we see the strong price rejection bounced off the 50% Fibonacci Retracement Line and is currently in the process of forming what is known as an “Inverse Head and Shoulders” pattern. This pattern gets its name simply because it has the following, easily identifiable characters:

  • A well defined neckline (shown in yellow)

  • A break of the descending trend line (shown in brown)

  • A left shoulder, a head which makes the lowest peak, and a right shoulder

  • A re-test of the neckline (at the time this image was made, the market was testing the neckline)

  • Finally, to confirm the reversal pattern, volume usually needs to increase after the re-test of the neckline to gain strength in the upward movement.

ETHUSD Micro View.png

Figure 2:  ETHUSD, GDAX, 30Min Candles

This sort of pattern is often traded in FOREX and stock markets because it is seen as a reliable and predictable indication of future price movement.  Typical price projections for Inverse Head and Shoulders are easily calculated with the following formula:

Price Movement = Price of the Neck Line (~$350) – Price of the Head (~$250) = ~$100

Price Target for Trend = Price Movement + Neck Line Price = $450

Given the strength of the macro-trend’s rejection of the 50% Fibonacci Retracement Line and the current pattern forming on the 1-hour charts, we must then look to other indicators to give us further market insight. Two commonly used momentum indicators, RSI (Relative Strength Index) and the MACD (Moving Average Convergence Divergence), show us that the price increase from the initial, aforementioned 50% Fibonacci Retracement Line rejection is welcomed with a rising trend on both momentum indicators; this shows us that the price growth still has upward momentum.

Summary:
  1. Although the sudden price drop was a bit terrifying for many investors and traders, it was much needed and has now shown the strong market value of ether.  

  2. Now that we have proven the strength in the market, it is very likely we will see new price highs in our future before we see further tests of lower prices.

  3. On a macro level, ETH-USD sentiment still remains bullish; on a micro level, we are seeing strong indications of a trend reversal from the sudden bear market over the past few days.


Trading and investing in digital assets like bitcoin and ether is highly speculative and comes with many risks. This analysis is for informational purposes and should not be considered investment advice. Statements and financial information on bitcoin Magazine and BTCMedia related sites do not necessarily reflect the opinion of BTCMedia and should not be construed as an endorsement or recommendation to buy, sell or hold. Past performance is not necessarily indicative of future results.

The post Ether Price Analysis: Price Movement Shows Strong Market Value appeared first on Bitcoin Magazine.

В сети ZCash состоится хардфорк Sapling

ForkLog В сети ZCash состоится хардфорк Sapling 29 октября в основной сети ориентированной на повышенную приватность криптовалюты ZCash состоится активация обновления Sapling, которое должно уменьшить необходимый для осуществления защищенных транзакций объем памяти в 100 раз […]