
September 10, 2026

Capitalizations Index – B ∞/21M

Bitcoin Price Intraday Analysis: BTCUSD Breaks Ascending Triangle

Bitcoin price intraday analysis: btcusd breaks ascending triangle

Bitcoin Price Intraday Analysis: BTCUSD Breaks Ascending Triangle


Bitcoin price
Advertisement

bitcoin price on Tuesday continued to stay capped by a stiff resistance near $6,500.

The BTC/USD pair started off today with a near-term bullish correction from intraday support near 6232-fiat. The upside looked strong during the Asian trading session and was able to go above 6500-fiat by the afternoon. However, the presence of a firm selling sentiment near the said resistance once again reversed the trend. The European session saw price slipping back to the 6400-ish range following the pullback.

As BTC/USD trends sideways, it has now broken below the ascending triangle. The downside hasn’t been much volatile, so the pair has a very valid potential to renter the triangular zone on a bounce back. If it does, we can consolidate sideways and create higher lows towards 6700-fiat before attempting an upside/downside breakout.

BTCUSD Technical Analysis
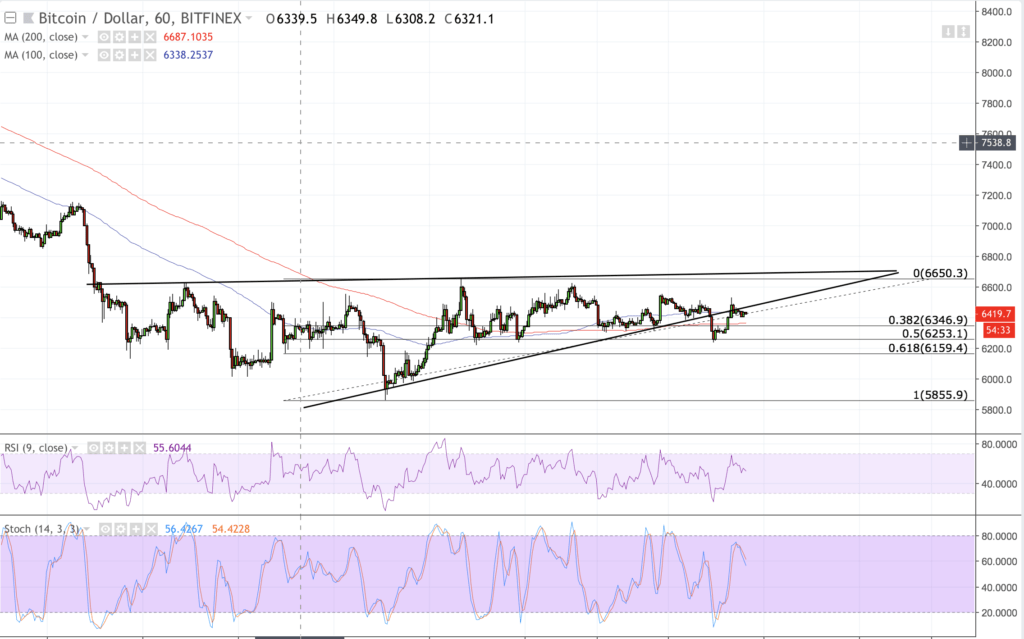
Bitcoin price intraday analysis: btcusd breaks ascending triangle

The BTC/USD is currently trading above its 100H and 200H moving averages. The 100H MA is itself above the 200H MA, indicating a lack of bearish action on the hourly BitFinex chart. The RSI and Stochastic indicators, meanwhile, have entered the territory of buying sentimentalists, with their heads down towards the south, indicating the current bearish correction.

Overall, the near-term bias is bullish.

BTC/USD Intraday Analysis

According to our intraday analysis, the range we are watching for today is defined by 6346-fiat as interim support and 6500-fiat as interim resistance. It is quite a narrow one to apply our intrarange strategy so that we will be directly starting with our breakout entries for the rest of the day.

Naturally, we will first wait for the price to retest 6346-fiat. On a bounce back, we will enter a long position directly towards our upside target near 6550-fiat. Placing a stop loss three-pips below the entry position will define our risk management perspective. However, if we continue to go down upon breaking 6346-fiat, we will enter a short position towards 6159-fiat, our downside target, while keeping a stop loss two-pips above the entry position.

There is also a third scenario in our breakout perspective. If price attempts a strong upside correction so that it breaks above 6550-fiat, then we’ll enter a long position towards the ascending channel resistance. In this position, we’ll keep our stops three-pips below the entry position to protect our trades from additional losses should the bias reverses.

Featured image from Shutterstock. Charts from TradingView.

Follow us on Telegram or subscribe to our newsletter here.
Join CCN’s crypto community for $9.99 per month, click here.
Want exclusive analysis and crypto insights from Hacked.com? Click here.
Open Positions at CCN: Full Time and Part Time Journalists Wanted.

Advertisement


Published at Tue, 21 Aug 2018 18:05:46 +0000

bitcoin Analysis

Previous Article

Should You Buy Feathercoin? Good Altcoin to Buy? FTC

Next Article

Enigma – The Rivers Of Belief

You might be interested in …

Chainlink | revolutionizing smart contracts

CHAINLINK | Revolutionizing Smart Contracts

CHAINLINK | Revolutionizing Smart Contracts What do you think about ChainLink? Do you think it will bring mass implementation of smart contracts to enterprise? Are you bullish or bearish? Feel free to leave a comment […]

Bitcoin Price Analysis: Bitcoin’s Parabolic Envelope Could Push to $8000s

Bitcoin Price Analysis

bitcoin has had a quite a year thus far, to say the least. A 10x return since the beginning of the year has put bitcoin on a parabolic growth path that is testing the limits of this 2-year long bull market:

Figure_1 (17).JPGFigure 1: BTC-USD, 3-Day Candles, Parabolic Growth Envelope

The gains have been incredible for those trading bitcoin for the last couple years, and it appears that this parabolic envelope is coming to a close. In order for this bull market to remain viable, it will need to keep up on a very aggressive, parabolic growth path that has the immediate upper resistance at between $8,000 – $9,000. Similarly, the lower support is around $5,800.

A break of either the support or resistance will put bitcoin in a very precarious position. If bitcoin breaks the upper, parabolic resistance trend and manages to find support on the trendline, this could signal an entirely new bull market. However, if bitcoin breaks the lower support, this would send a very, very bearish signal to traders, indicating a breakdown of the 2-year long bull market.

Given the trend we have seen over the last two years, it would not be at all surprising to see a test of the $8,000s before any sort of market correction (micro or macro) takes place. We are on a very aggressive growth path and, on a macro-scale, one that has has shown a consistent trend of testing the upper curve prior to correction.

This is a very strong bull market and it it should not be underestimated. However, in an effort to remain objective, it’s important to present the not-so-obvious argument and state the consequences of a disruption of this macro bull market.

Figure_2 (14).JPGFigure 2: BTC-USD, 1-Day candles, Retests of Previous All-time Highs

Throughout the life of this parabolic run, bitcoin has shown a penchant for retests during market pullbacks. We can see in the image above that every time the market peaks the upper resistance curve, it has pulled back to retest the previous all-time high before the resumption of uptrend. Part of the consequences of this parabolic growth is we are at a point where the growth is so aggressive that a retest of the previous all-time high would throw the market trend well outside the parabolic envelope. And, as stated above, that would send a very strong macro bearish signal to traders and investors as this marks a breakdown of the 2-year long trend.

Summary:

  1. The parabolic trend bitcoin has seen over the last two years is approaching a very aggressive level that could make bitcoin see aggressive price swings in the coming weeks.

  2. The upper boundary of the parabolic curve could have bitcoin testing the $8,000s.

  3. A break below the lower curve could spark a macro bear market as this signals the breakdown of the bull market’s multi-year trend.

Trading and investing in digital assets like bitcoin and ether is highly speculative and comes with many risks. This analysis is for informational purposes and should not be considered investment advice. Statements and financial information on bitcoin Magazine and BTC Media related sites do not necessarily reflect the opinion of BTC Media and should not be construed as an endorsement or recommendation to buy, sell or hold. Past performance is not necessarily indicative of future results.

The post Bitcoin Price Analysis: Bitcoin’s Parabolic Envelope Could Push to $8000s appeared first on Bitcoin Magazine.