November 2, 2026

Capitalizations Index – B ∞/21M

Bitcoin Price Analysis: Weak Rally Gives Bitcoin Second Chance at Support Test

Bitcoin price analysis: weak rally gives bitcoin second chance at support test

Bitcoin Price Analysis: Weak Rally Gives Bitcoin Second Chance at Support Test

Within minutes of rumors spreading regarding the SEC’s classification of both bitcoin and ether, the entire crypto market breathed a sigh of relief as everyone enjoyed a nice bounce. Prior to the news, bitcoin saw several days when buyers began to disappear from the market. After bottoming in the low $6,100s, the SEC news spread and a modest rally on relatively low volume ensued:
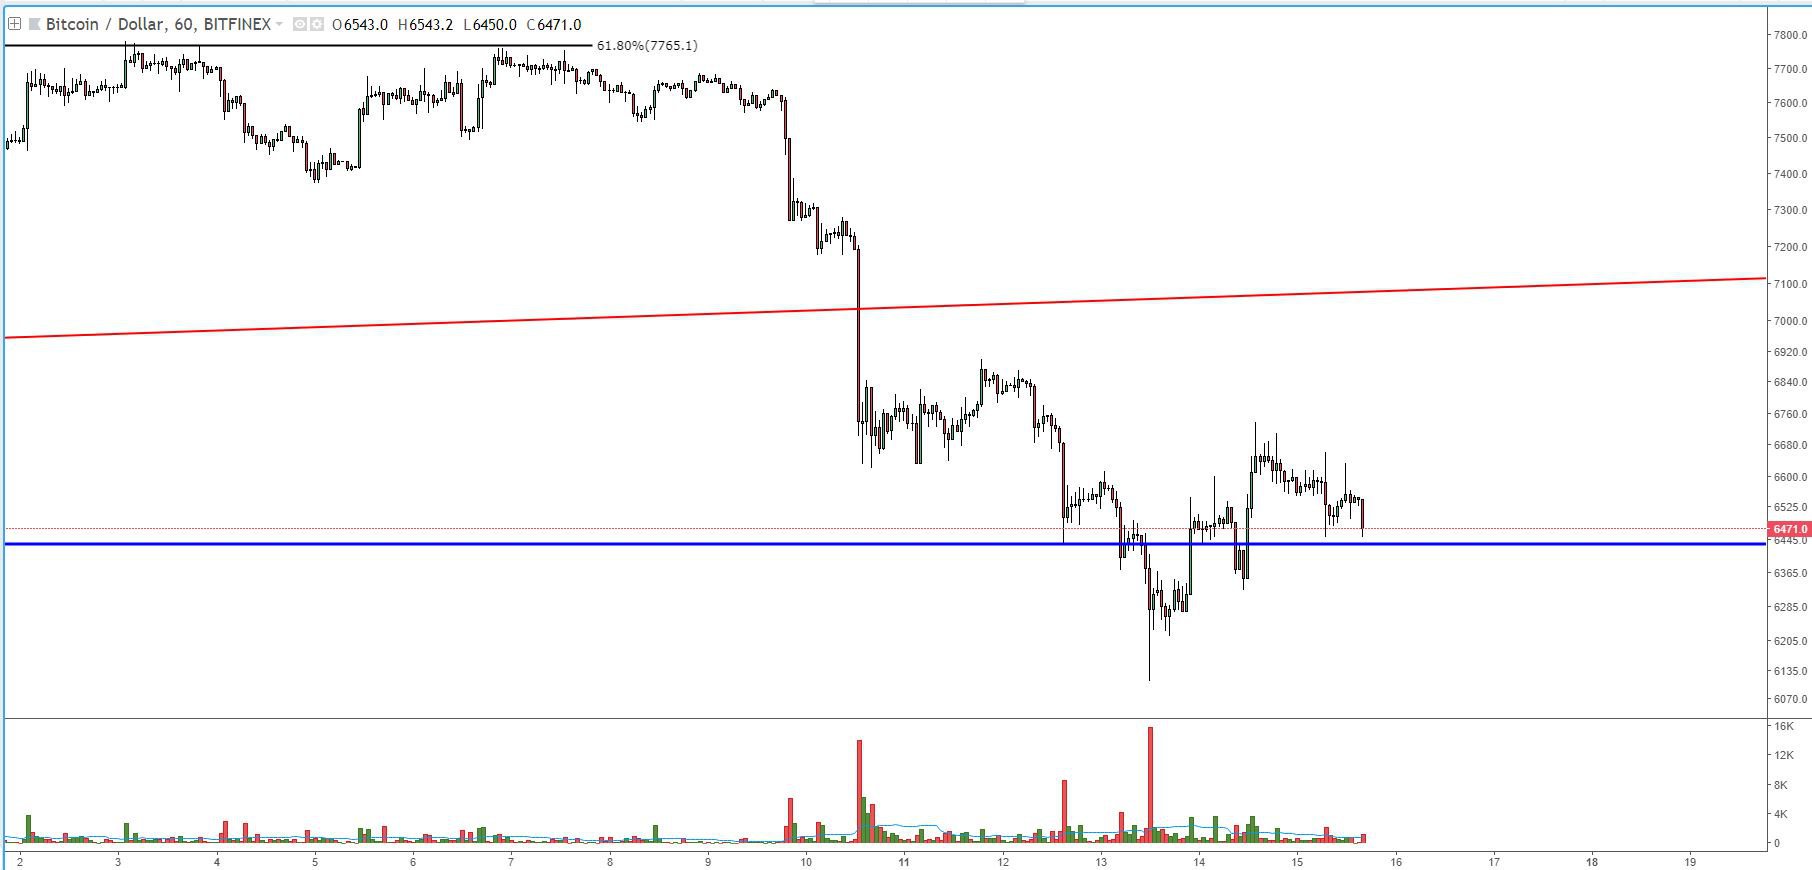
Fig 1Figure 1: BTC-USD, 1-Hour Candles, Weak Rally

Although the move was sudden, the overall volume behind the move was poor. You can see on the hourly candles that the volume barely made a noticeable blip on the radar. However, one noteworthy thing occurred during the rally: The price managed to break back into the macro trading range it has been bound by for the last 5-6 months:
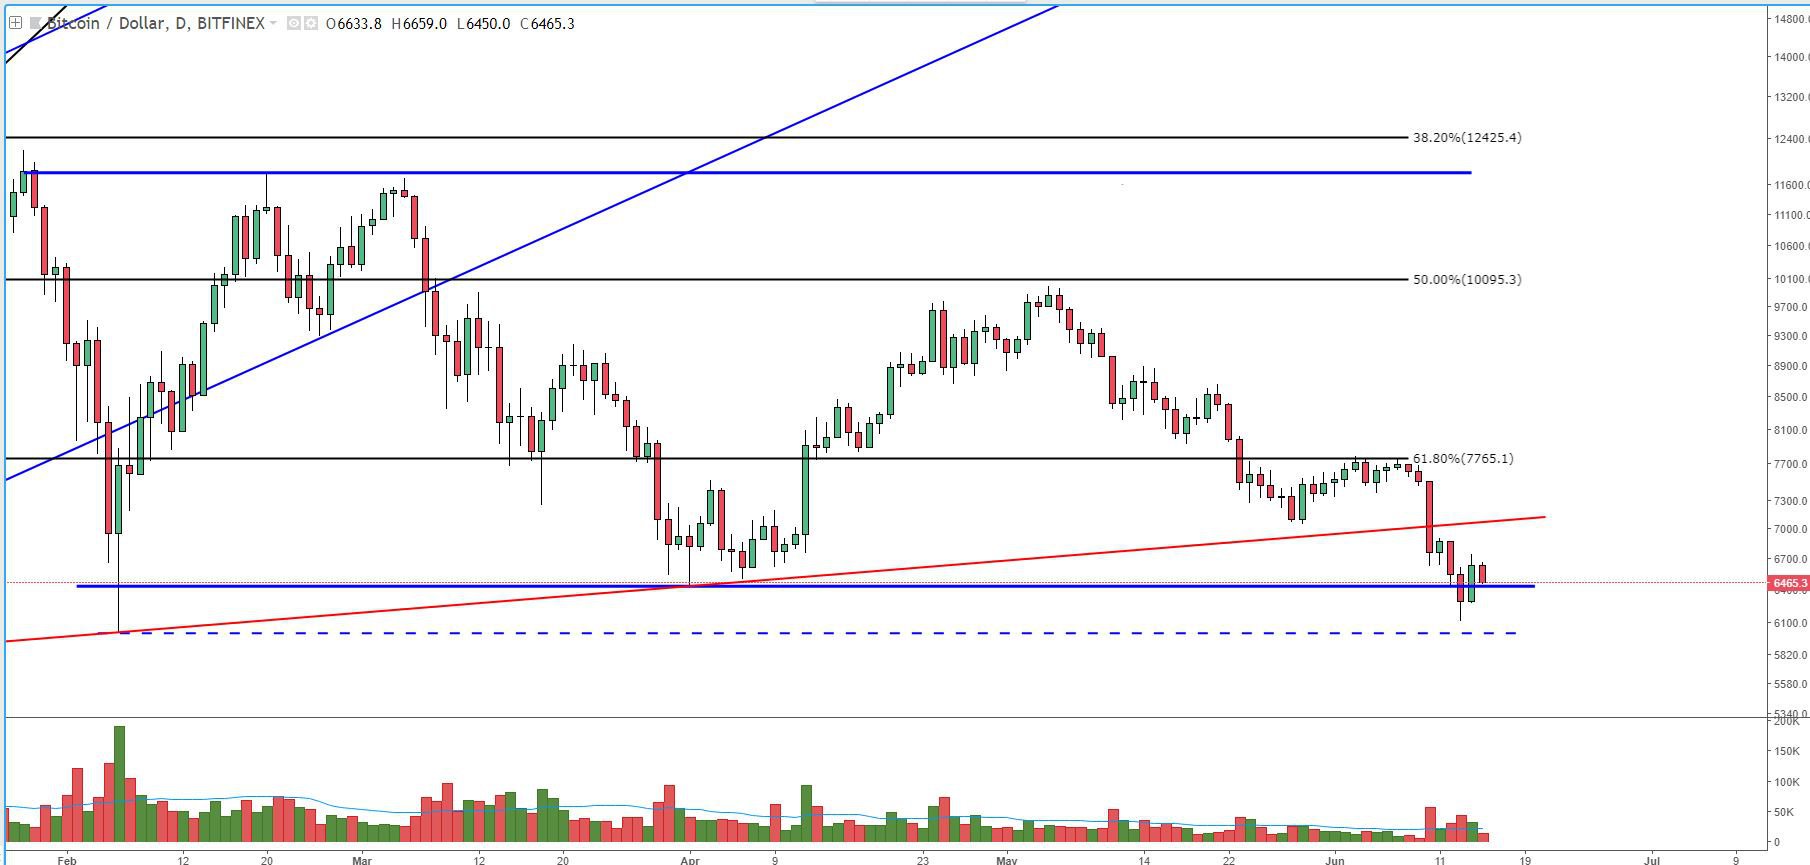
Fig 2Figure 2: BTC-USD, Daily Candles, Macro Trading Range

Part of our previous discussion centered around known support levels and their implications. The first line of support was outlined around the $6,450 values. As you can see, the price temporarily dipped below support on high volume and saw a short closing rally which pushed the price back into the TR. Now, at the time of this article, we are testing the support of the $6,450 range again. If we fail to hold support, we will undoubtedly test the support of the February low ($6,000).

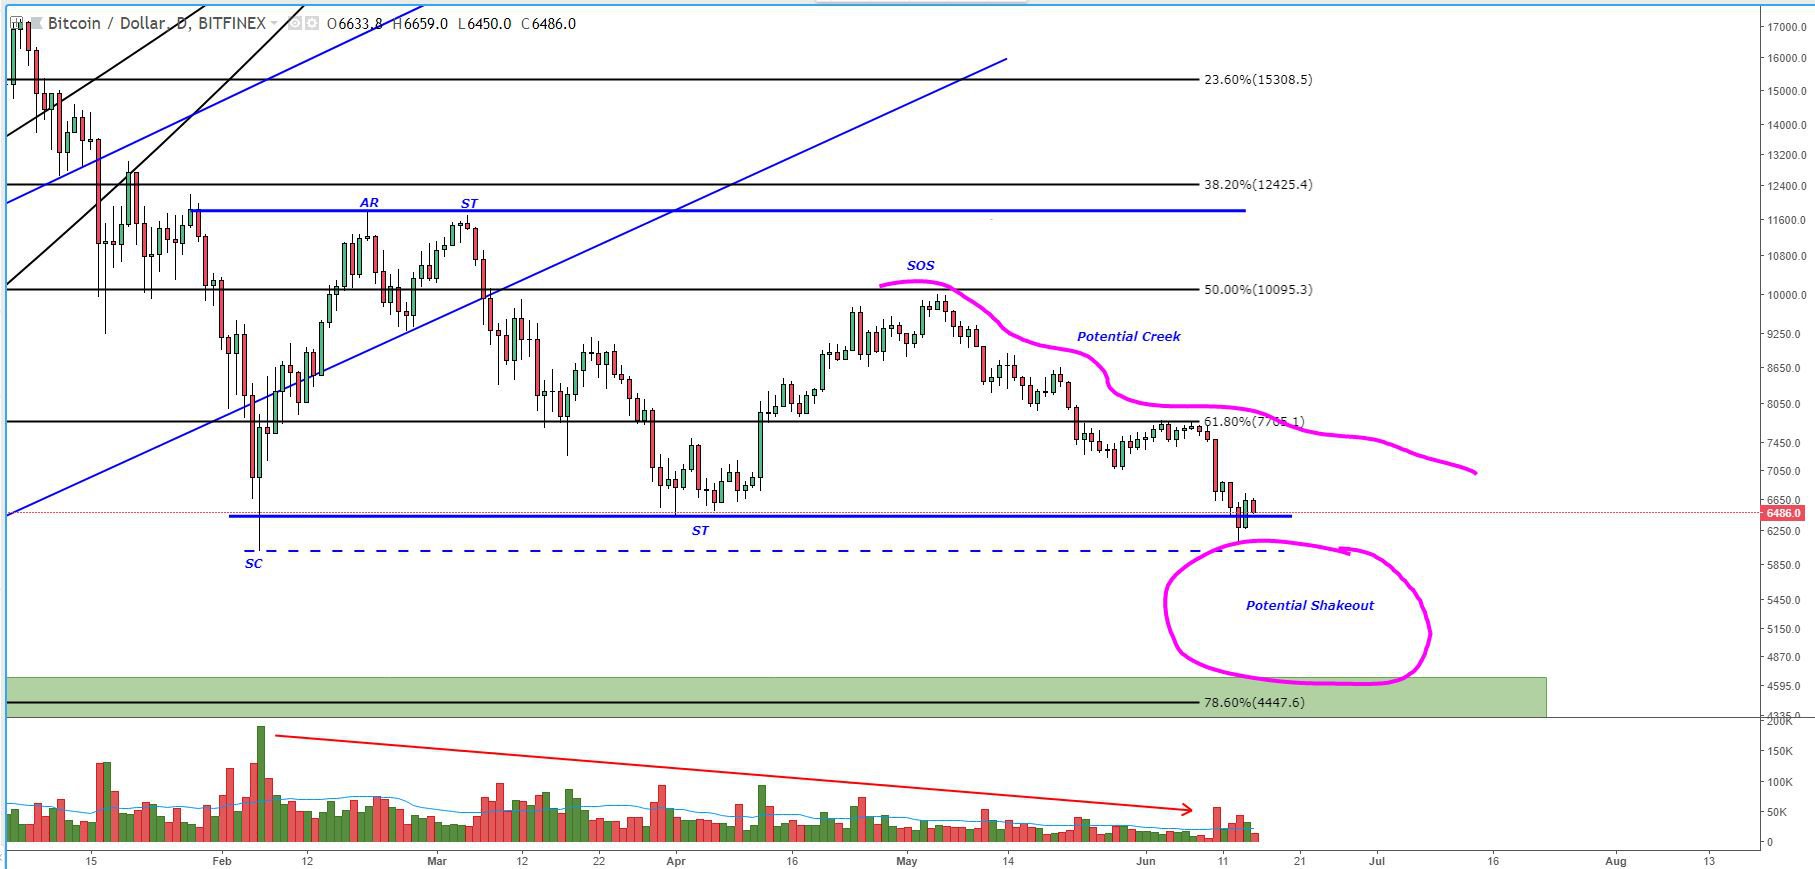
Although we are trending down for now, there is an argument to be made from a macro perspective that we are actually witnessing supply absorption within the context of a large scale Accumulation Trading Range (TR). The volume trend suggests that there is potential supply absorption and we are now heading toward a potential shakeout (sometimes referred to as a “spring”):
Fig3
Figure 3: BTC-USD, Daily Candles, Potential Accumulation TR

The low-volume, meandering price structure over the last several weeks is very representative of what is known as a “creek” within a TR. A creek is basically meant to grind down investors, bore them, and ultimately demoralize them prior to a shakeout. It’s designed to make the investor think “bitcoin is dead,” essentially.

Granted, the aforementioned accumulation TR argument should be taken with a HUGE grain of salt as this still has several tests it must pass before any degree of confidence can be placed on it.

First, we must see how support holds on the test of the $6,450 and $6,000 levels. Then, we must see how the price reacts to new lows in the event that we break to the downside of this TR. And, even then, it is still very difficult to identify a spring while you are in the middle of it.

So, just use caution when attempting to trade this TR because it is fraught with bull traps, bear traps and every other kind of trap you can think of. For now, we need to just play it day by day and look at the cards as they are dealt.

Summary:

  1. Rumors of SEC categorization of bitcoin and ether preceded a modest rally on low volume.
  2. The low volume indicates that sellers are still reluctant to return to the market.
  3. We are currently in the process of testing important support levels and we need to keep a skeptical eye as monitor the market and gage the reaction to these new support tests.

Trading and investing in digital assets like bitcoin and ether is highly speculative and comes with many risks. This analysis is for informational purposes and should not be considered investment advice. Statements and financial information on bitcoin Magazine and BTC Media related sites do not necessarily reflect the opinion of BTC Media and should not be construed as an endorsement or recommendation to buy, sell or hold. Past performance is not necessarily indicative of future results.

Published at Fri, 15 Jun 2018 21:23:34 +0000

bitcoin

Previous Article

Jeff Garzik on His Newest Venture and Keeping Time With an Evolving Space

Next Article

10kt Gold Splashed Onyx Pendant Necklace (BITCOIN ACCEPTED)

You might be interested in …

Op-ed: Bitcoin Is Not a Bubble; It's in an S-Curve and It's Just Getting Started

Op-ed: Bitcoin Is Not a Bubble; It's in an S-Curve and It's Just Getting Started

One of the most intriguing stories underpinning the recent rise of bitcoin prices is how financial institutions will interact with the currency.

The upcoming CBOE futures market is going to open the door for Wall Street giants to participate in the market. That could spell moon or doom for bitcoin, and everyone is speculating on what may happen next.

It is this Wall Street/BTC interaction (phenomenon) that may be driving the unbelievable price spike of the past few days — at least partially.

On the macro scale, however, we may be witnessing a more grand pattern forming; a price-correlated S-curve.

The S-curve is the classic adoption curve applied to the advent of new technologies. As a percentage of the population, adoption looks like a lag phase where the technology is utilized by the innovators of said technology, followed by an early adoption phase led by people who often take risks in order to be the first movers in a space. After the early adopter phase (~16% of the population is now participating), there comes a great “tipping point” where the wide use of the technology seems inevitable. The tipping point gives rise to the “Early Majority” joining in on the fun, followed by the late majority and, finally, the holdouts who allow the top of the S to asymptotically approach total adoption. The curve, as a factor of time and adoption, looks sort of like the following:

Screen_Shot_2017-12-08_at_9.56.44_AM.png

This curve correlates nicely with adoption of some of the greatest technological innovations in our recent history:

Screen_Shot_2017-12-08_at_9.57.15_AM.png

Some important things to note is that this is just U.S. adoption. Much of the world lagged behind the U.S. in the consumer appliance boom of the 1900s. All of these curves, however steep, do follow the same S-curve trend fairly nicely.

So what could that mean for bitcoin? It’s difficult to choose a metric to define bitcoin adoption, and, in fact, there are disputes about if one metric accurately captures it. However, for simplicity I’ll highlight Google searches for bitcoin and Coinbase user count as microcosms of the global adoption trend.

google search

Screen_Shot_2017-12-08_at_9.58.02_AM.png(from CNBC)

This seems to show a very similar pattern to what could be the transitional phase between “innovators” and “Early Adopters.” Just to harken back to the earlier statement though — it’s very difficult to put a number on bitcoin adoption.

So why is this remarkable? bitcoin may be the first “buyable” S-curve. Because this is a capped-supply currency, more users adopting and using it necessitates an increase in price. Whether that correlation is even reflective of the current price action is a practically unanswerable question, and the obvious leaning would be towards there being a speculative additional value. However, with an increase in adoption, there seems to be a floor rising up to catch whatever “bubble burst” might occur, if and when it happens.

https://platform.twitter.com/widgets.js

“Eternal September” is the phrase used to describe September of 1993, when widespread internet adoption began to look inevitable. It occured after AOL began a mailing campaign offering free trials of its internet service, leading to an influx of internet users that has since never ended. Hence “Eternal September.”

https://platform.twitter.com/widgets.js

To compare bitcoin’s adoption to its complement — the internet — this may very well be the “Eternal September” episode for bitcoin.

If the S-curve adoption theory applies to bitcoin, then buckle up. I won’t pretend to be able to predict a spot price, but I will say I think we may be sitting close to another order of magnitude this time next year.

See y’all on the moon.

Corollary: Bulls sound smart in bull markets. We may look back and laugh at this thought, or it may hold true for years to come. Time will tell. ‘Til then, buy bitcoin.

Trading and investing in digital assets like bitcoin and ether is highly speculative and comes with many risks. This analysis is for informational purposes and should not be considered investment advice. Statements and financial information on bitcoin Magazine and BTC Media related sites do not necessarily reflect the opinion of BTC Media and should not be construed as an endorsement or recommendation to buy, sell or hold. Past performance is not necessarily indicative of future results.


The post Op-ed: Bitcoin Is Not a Bubble; It's in an S-Curve and It's Just Getting Started appeared first on Bitcoin Magazine.

Cryptocurrency lending on the rise says Genesis Capital

BNC insights feed Cryptocurrency lending on the rise says Genesis Capital Despite the current bear market, a report by Genesis Capital reveals that digital asset lending has continued its uptrend through 2018 more info…