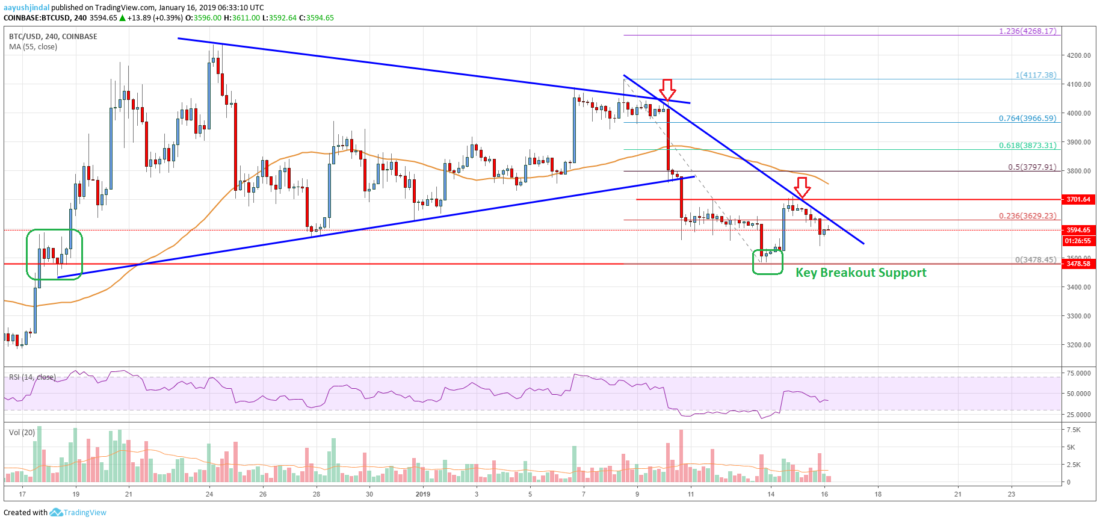
- bitcoin price declined recently and settled below the $3,700 support area against the US Dollar.
- There was a break below a crucial contracting triangle with support at $3,780 on the 4-hours chart of the BTC/USD pair (data feed from Coinbase).
- The price tested the next important support at $3,480 and it is currently consolidating losses.
bitcoin price is struggling to gain bullish momentum above $3,700 against the US Dollar. BTC must stay above $3,480 to avoid a downside break towards $3,200 in the near term.
bitcoin Price Analysis
After , bitcoin [BTC] price faced a fresh round of selling against the US Dollar. The BTC/USD pair started a sharp downward move and broke the $4,000, $3,800 and $3,750 support levels. There was even a close below the $3,700 level and the 55 simple moving average (4-hours). It opened the doors for more losses and the price traded below the $3,600 support.
More importantly, there was a break below a crucial contracting triangle with support at $3,780 on the 4-hours chart of the BTC/USD pair. The pair even spiked below the $3,500 support before buyers took a stand near the $3,480 support area. Later, the price started consolidating losses and corrected above the $3,600 level. Buyers pushed the price above the 23.6% Fib retracement level of the last decline from the $4,117 high to $3,478 low. However, the acted as a strong resistance and prevented an upside break. Besides, there is a connecting bearish trend line in place with resistance at $3,640 on the same chart.
Looking at the , bitcoin [BTC] price must gain strength above the trend line and the $3,700 resistance to move into a positive zone. The next hurdle is near $3,800 and the 50% Fib retracement level of the last decline from the $4,117 high to $3,478 low. Alternatively, a downside break below $3,480 may push the price towards $3,330 or $3,220.
Technical indicators
4-hour MACD – The MACD for BTC/USD is placed in the bearish zone, with hardly any positive sign.
4-hour RSI (Relative Strength Index) – The RSI is currently well below the 50 level.
Key Support Level – $3,480
Key Resistance Level – $3,700
Published at Wed, 16 Jan 2019 10:00:02 +0000
