August 2, 2026

Capitalizations Index – B ∞/21M

Bitcoin Price Analysis: BTC Ranging, Russia’s Grand Plans

Bitcoin price analysis: btc ranging, russia’s grand plans

Bitcoin Price Analysis: BTC Ranging, Russia’s Grand Plans

  • bitcoin Price is ranging inside Jan 6 high low
  • Russia may convert their USD Reserves to BTC to bypass sanctions
  • Trading volumes are low

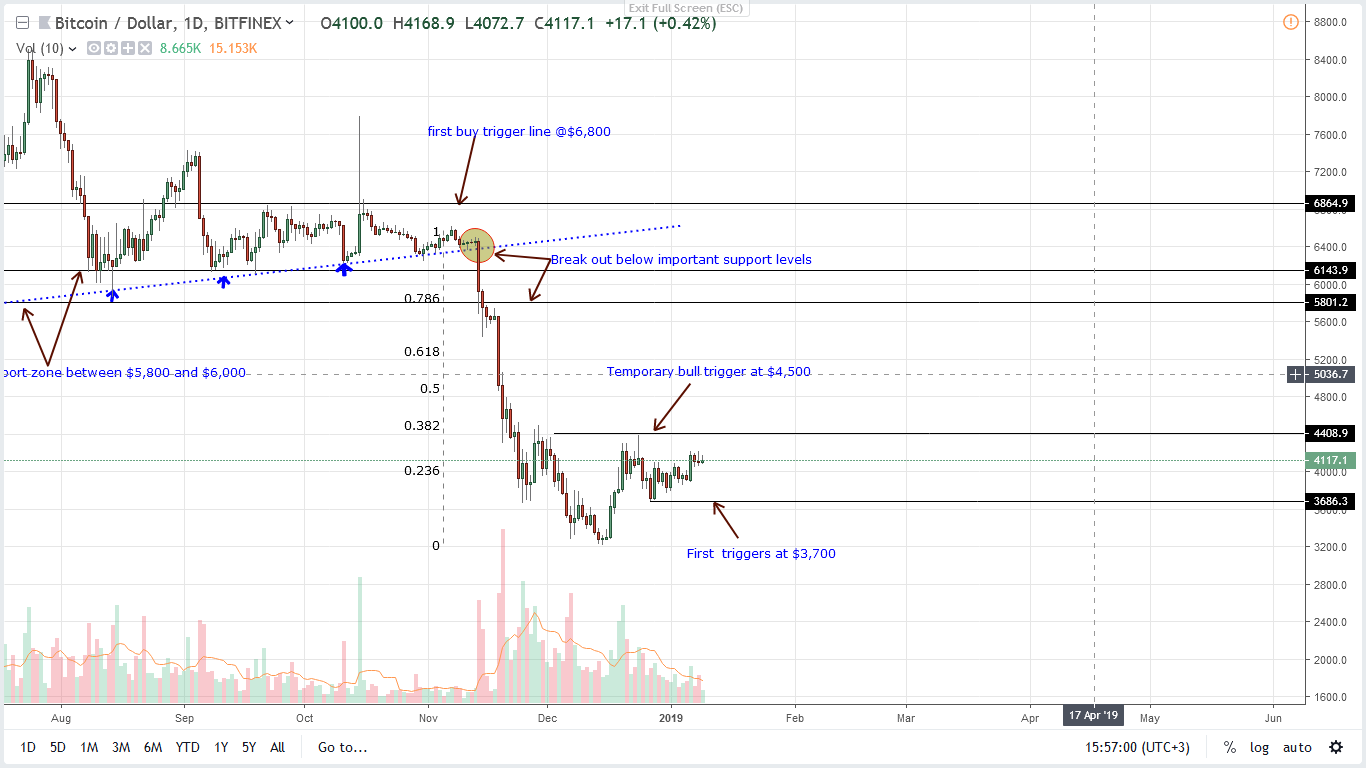
Technically, BTC is bearish from a top-down approach but bullish in the short term. We expect ecstatic buys if bulls drive prices above $4,500 and, in that case, first targets will be at $6,000.

bitcoin Price Analysis

Overview

At the time of press, BTC is up 5.3 percent against the USD in the last seven days. Nonetheless, we are net bullish and expect prices to recover thanks to favorable macros and accompanying candlestick arrangement that shouts bullish.

From the chart, it is clear that prices are consolidating. Depending on the breakout direction, the short-term trend will determine whether we have a distribution or an accumulation. If prices edge higher in line with mid-December bullish thrusts, then the double bar bull reversal pattern of the week ending Dec 23 would be correct.

Fundamentals

On the fundamental front, news has it that the Russian government has plans in place to diversify their cash holdings into bitcoin in case sanctions are imposed.

While there are other reserve currencies, the state level adoption and this change of heart by Russia won’t bode well with politicians. However, on matters crypto and bitcoin, any form state adoption will open up doors for bitcoin.

According to reports, Vladislav Ginko, a Russian Professor with ties to the Kremlin said bitcoin is the only way of by-passing damaging US and NATO Sanctions. Should there be such orders, Russian elites will quickly diversify their cash reserves into bitcoin further cementing the coin status as a duo asset that can serve as a medium of exchange and at the same time a store of value.

Remember, reports have it that Russia is sitting on more than $450 billion of reserves. If the government is forced to liquidate any amount, then BTC would surge to new highs.

Candlestick Arrangement
Bitcoin

Meanwhile, BTC/USD prices are ranging in lower time frames and virtually unchanged in the last day. Unless otherwise there are dips below $3,700, our previous trade plans are constant.

All in all, prices are oscillating inside Dec 28 high low is bullish from an effort versus result point of view. Up-thrusts above $4,500 would spur demand, and as per our projection, BTC will likely surge towards $6,000.

Technical Indicators

Like yesterday, transaction volumes are light pointing to market participation. To reiterate, upswings lifting BTC above $4,500 should exceed 120k or above the current average of 15k.

All Charts Courtesy of Trading View–BitFinex

Disclaimer: Opinions are those of the author. Do your Research.

Published at Wed, 09 Jan 2019 15:00:23 +0000

Previous Article

Nano (NANO) and BitGrail Crypto Exchange Dragged to Court by Silver Miller and Levi Korsinsky

Next Article

Will Bitcoin [BTC] Rebound in 2019? The Bull vs. Bear Case

You might be interested in …

Bitcoin Price Analysis: Watching World Events and “Three Pushes to a High”

Bitcoin Price Analysis

BTC-USD is up 160% in the 6 weeks since it last bottomed out at around $1800. The $2850 growth marks the sixth week in a row of new highs and aggressive bull runs as bitcoin sits upon its current all-time high in the $4600s. One can’t help but wonder where the top of this run lies; Goldman Sachs is calling the top of the bull run at around $4800.

Historically, during times of war and political uncertainty, investors tend to seek financial safe havens in precious metals and other long-lasting, stable investment vehicles. Yesterday, North Korea made an aggressive move toward Japan by launching a missile over Japanese airspace. Within hours of the news hitting the public, bitcoin saw massive price growth, thus establishing, once again, a new all-time high:

Figure_1 (3).JPGFigure 1: BTC-USD, 6 Hour Candles, Bitfinex, Volume Spike Post-news Release

After an entire week of decreasing volume, BTC-USD saw a spike in buy volume once the news of North Korea’s aggression hit the public. This is one of several bullish moves in the recent series of news events following North Korean aggression. As of the time of this article, Japan has yet to formally respond to this act of aggression, and one can speculate that bitcoin will likely continue to see price growth as the political uncertainty continues to grow.

On the macro scale, bitcoin is showing signs of bullish exhaustion despite the push to greater highs:

Figure_2 (3).jpgFigure 2: BTC-USD, 1-Day Candles, Bitfinex, Signs of Bullish Exhaustion

Although there is a good argument for bitcoin price growth on just fundamental analysis of the North Korean situation alone, it’s important to remain objective in our analysis. There are three signs of bullish exhaustion in the macro trend of this BTC-USD market.

Although bitcoin is making new price highs, on the 1-day candle trend the RSI is failing to make a new high (shown in yellow) — this activity is called “divergence” and shows a decrease in bullish momentum. Additionally, although the 6-hour volume made a significant impact on the market, the 1-day volume is currently failing to make any significant impact on the overall trend (shown in blue).

Lastly and most significantly, the 1-day Bollinger Bands (shown in pink) have begun to go completely horizontal and are now beginning to actually curve downward.

The current Bollinger Band trend accompanied by the bullish momentum loss is pushing BTC-USD into a potential reversal pattern known as “Three Pushes to a High.” Basic characteristics of this pattern are:

  1. Narrowing Bollinger Bands upon the advance of each high;

  2. Momentum loss on various indicators;

  3. Continued divergence across all three highs.

Currently, the “Three Pushes to a High” reversal has yet to be confirmed and is certainly not in a tradable condition, but it is something that every bitcoin trader should consider on the macro trend of this market.

Since the run from $1800, well established Fibonacci Retracement lines have revealed themselves on the market:

Figure_3 (4).JPGFigure 3: BTC-USD, 6 Hour Candles, Bitfinex, Macro Support Lines

There is very strong support on the 23% line, as the market consolidated for about a week at those values. If our current price level proves to be the top of this run, a possible retracement might occur. Should a retracement occur, Figure 3 will be an important reference in order to see, on a macro scale, where the support levels lie and where potential market entry and exits will exist.

Summary:

  1. Uncertainty surrounding Japan’s response to North Korean aggression reveals investor interest in bitcoin;

  2. Technical indicators show the market is possibly approaching its top on the macro-trend;

  3. Support lines exist on the Fibonacci Retracement values shown in Figure 3.

Trading and investing in digital assets like bitcoin, bitcoin cash and ether is highly speculative and comes with many risks. This analysis is for informational purposes and should not be considered investment advice. Statements and financial information on bitcoin Magazine and BTC Media related sites do not necessarily reflect the opinion of BTC Media and should not be construed as an endorsement or recommendation to buy, sell or hold. Past performance is not necessarily indicative of future results.

The post Bitcoin Price Analysis: Watching World Events and “Three Pushes to a High” appeared first on Bitcoin Magazine.