Will bitcoin bore traders with a second day of sideways trading or are we bracing for the long-awaited breakout over $10k?
Market Overview
bitcoin and other cryptocurrencies have ascended at a steady pace over the last 3 weeks and it appears that bitcoin has developed an impressive immunity against the usual correction triggers of tax selling, regulatory fears, exchange hacks and other FUD that have plagued crypto-markets since Q1 2018. In fact, at the moment there appears that positive cryptocurrency stories outweigh the negatives.
- On April 25th BTC CME futures recorded the highest of futures contracts ever and it’s clear that investors are beginning to direct their attention and money back towards cryptocurrencies.
- BTC racked up a during the month of April.
- In general, cryptocurrencies are increasing in value with numerous coins performing well and since the April 6th low the market has added $188 billion to peak at a market cap of !
- Sentiment wise, all is well and dandy for the moment, but we must remember that crypto markets frequently exhibit wild mood swings and there are one or two possible events that could take a bit of wind out of BTC’s sails.
Mt. Gox Liquidation
There has been news that Mt. Gox custodian Nobuaki Kobayashi recently transferred more than dollars from the Mt. Gox cold wallet. BTCs pullback from a 2017 record high was partially attributed to Kobayashi’s previous liquidation of $400 million dollars worth of BTC in December 2017 – February 2018 and there are fears that an upcoming sale will occur as BTC climbs to new highs. Not to mention, there is still $1.9 billion of BTC and BCH waiting to be sold.
Highlights
Markets were relatively stable over the weekend and BTC continues to bobble sideways as it continuously springs off support at $9,000 – $9,200 on its journey towards $10,000. It should come as no surprise that movement towards new highs will be punctuated by sharp pullbacks and 3 or 4 days of sideways trading. BTC topped $9,700 on April 25th and $9,500 4 days later, but the technical setup for BTC and a handful of other altcoins remains positive.
As discussed previously, BTC will likely meet sellers as it approaches $9,700 and $10,000 again but this should be expected as markets tend to retrace a bit after breaking through resistance shelves and it can take a moment for upward trends to re-establish.
Alternatively, accelerated breakouts tend to occur when higher highs and higher lows are set against prior trend highs as this shows strength within the asset but in these situations one should pay close attention as overbought conditions develop quickly and more severe retracements can occur.
Daily Chart
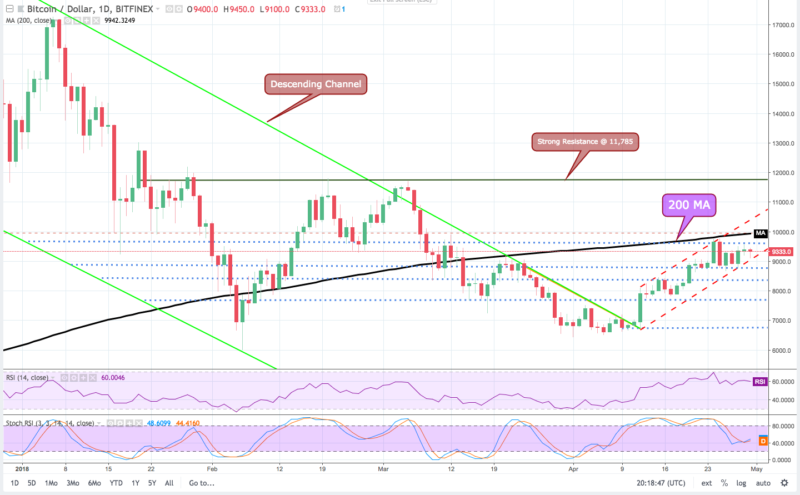
- BTC met sellers near $9,762 and continues to struggle to reach the 200-day MA at $9,963. BTC has also encountered resistance at $9,500 twice and traded on lowered volume within a tightening range of $9,100 – 9,400.
- In spite of this, the rising trend is still intact and a path toward $10,000 may open up if BTC can trade above $9,500 for 4 hours and a close above $9,500 would further encourage this movement.
- RSI remains in bullish territory and at the time of writing the Stoch is beginning to show oversold conditions but is not overly concerning as BTC continues to trade within the ascending channel in the $9,100 – $9,400 range and is most likely going through a period of consolidation before attempting a run up to and over $9,500.
4HR Chart
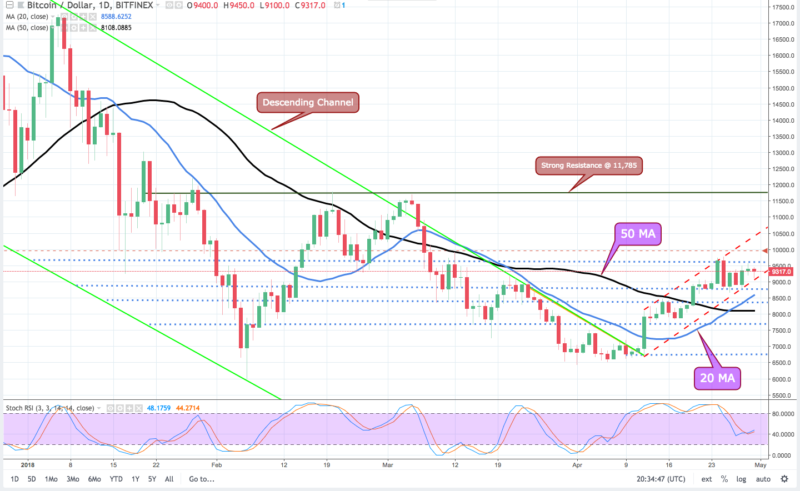
- At the time of writing, the 20 and 50-day MA continue trending upward with the 20 above the 50 and on pullbacks, BTC rests comfortably along the $9,100 – $9,200 support level.
- Again, the underlying bullish trend appears secure as the 4-hour chart shows BTC continuing to trade in the ascending channel and a similar set up can be seen with the 5 and 10-day MA indicating further range-bound trading in the short term and an eventual breakout once BTC holds gains above $9,500.
- At the moment, BTCs tight trading range does not offer an attractive risk-reward scenario so day and swing traders would be better served by taking up positions after BTC crosses the $9,500 resistance with profit taking at $10,500, $11,200 and possibly $11,500.
- There is strong resistance at $11,750 where BTC failed and reversed in early March but of current market sentiments, volume and continued positive news regarding cryptocurrencies could fuel a rally that may push BTC right over this resistance towards $12,200.
- A drop under $9,000 should raise some concerns but there is support at $8,800 and stronger support near $8,450. Previously, excited buyers showed up from $7,800 to $8,300 so this region might be a good purchasing point for all types of investors.
- A close below $9,000 could indicate a break in the current trend and initiate a reversal that could push prices back towards $8,400.
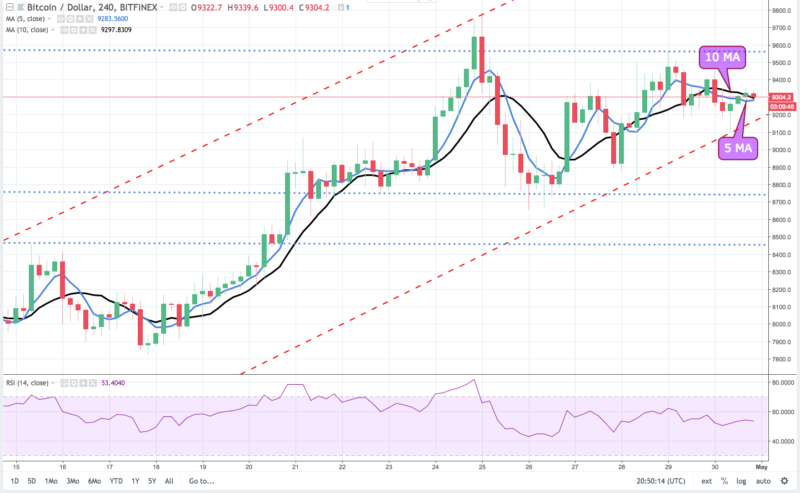
- At the time of writing the 5 and 10-Day MA have flattened and begun trending south but after crossing both remain very close to each other.
- Again, this should not be a cause for concern as the Stoch and MACD suggest oversold conditions and BTC continues to trade sideways in its current $9,100 to $9,500 range.
Vision
- After hitting rock bottom then maintaining 4 consecutive weeks of growth, it appears that BTC and altcoins are in the early stages of what we can hope will be a prolonged uptrend.
- BTC still needs to break above the 200-day MA ($9,963) and it appears that extending above $9700 remains a challenge.
- Determining whether BTC extends higher, reverses or continues trading sideways in the short term is dependent upon whether the cryptocurrency notches lower highs and lower lows so traders are advised to keep an eye on where BTC closes during the next day or two.
- As suggested , the long-term outlook for BTC is still overwhelmingly positive and the path above $10,000 seems imminent.
- A close below $9,000 would break the current ascending trend and push BTC back towards $8,400.
- $8,800 – $8,450 remain the most immediate support levels. $7,800 and $7,600 follow.
- Day and swing traders should refrain from purchasing while BTC trades within the $9,100 – $9,400 range as it might be more rewarding to purchase on strength when BTC holds gains above $9,500.
- In the event of a sharper pullback, $7,800 – $8,300 could be a good entry point for all types of investors.
Disclaimer: The views expressed in this article are not intended as investment advice. Market data is provided by . The charts for analysis are provided by .
Where do you think bitcoin price will go this week? Let us know in the comments below!
Image courtesy of Wikimedia Commons, Tradingview.com
Published at Tue, 01 May 2018 01:00:21 +0000