September 18, 2026

Capitalizations Index – B ∞/21M

Bitcoin NVT Topping Pattern

Bitcoin nvt topping pattern

Bitcoin NVT Topping Pattern

Bitcoin nvt topping pattern

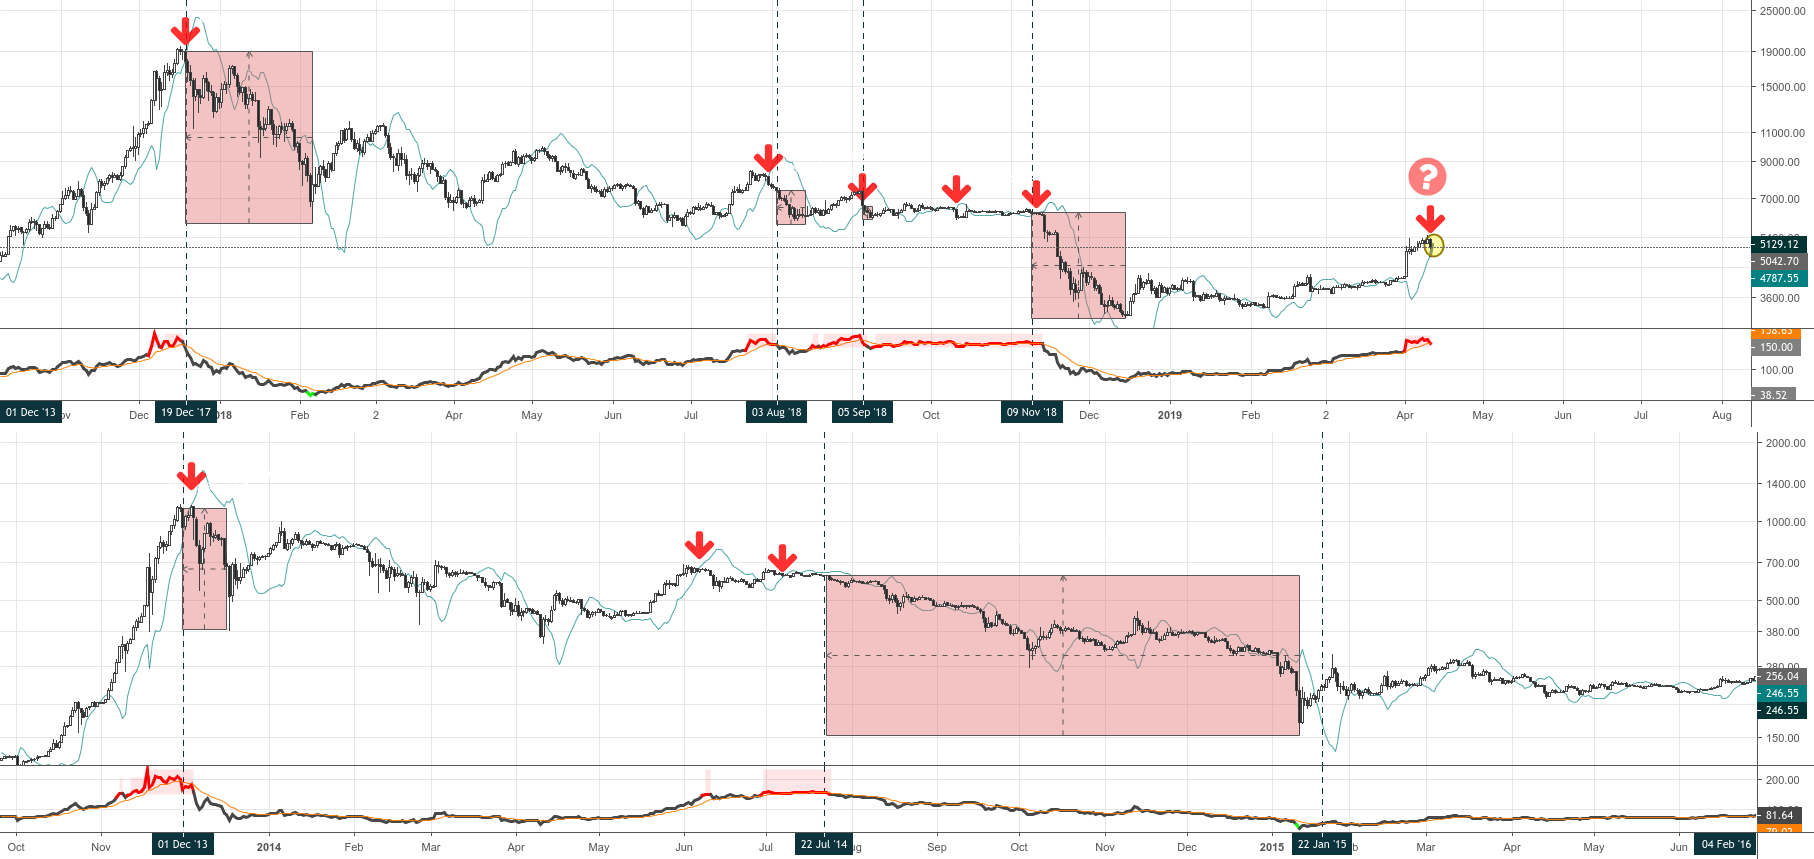
Now that the NVT indicator is back in the red zone, I wanted to look back at the bitcoin chart to spot potential topping patterns.
I am seeing a likely NVT cross with its signal line by the end of the day (still unconfirmed).
And at the same time, I am plotting here the Dinapoli Momentum Switch indicator in search for key correlations.
And we can see two potential outcomes out of this event happening when the NVT line was red:
a) The start of a significant down correction
b) A choppy consolidation period in front of us where NVT would keep flashing red for some time… just to resolve in a significant down correction
Either way, the results look very consistent… not even a single time a bull trend has started right after these two factors were in confluence. I’d say it became quite the opposite. Is this time different?

Published at Thu, 11 Apr 2019 15:01:55 +0000

Previous Article

How Mobile Browsers Are Driving the Next Wave of Cryptocurrency Adoption

Next Article

A Beginner’s Guide to Trading on Bittrex

You might be interested in …

Status launches incubator to help blockchain startups succeed

CryptoNinjas Status launches incubator to help blockchain startups succeed Status.im, one of the first mobile Ethereum clients built entirely on peer-to-peer technologies, today is introducing Status Incubate, a new service to provide early-stage blockchain-based startups with […]

Bitcoin: gettin' trendy with support & resistance

Bitcoin: Gettin' Trendy with Support & Resistance

bitcoin: Gettin' Trendy with Support & Resistance EN English (UK) EN English (IN) DE Deutsch FR Français ES Español IT Italiano PL Polski SV Svenska TR Türkçe RU Русский PT Português ID Bahasa Indonesia MS […]