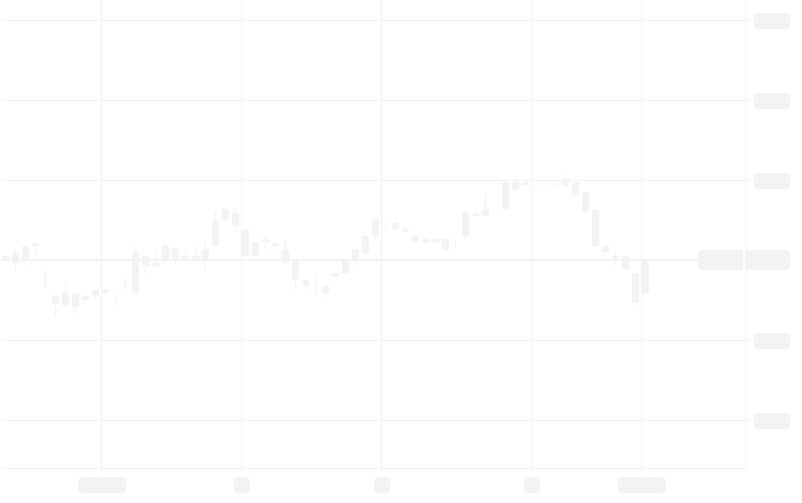
BITCOIN Continues to Look Bullish in This 3-Day TF
Posting the 3-Day chart AGAIN because Trading View’s platform will likely scrunch up the cover chart for this publication.
Here’s my History Chart from Beginning to End using Wyckoff Method: You will see two (2) previous Accumulation Schematics (Beginning 2012 and 2015) along with a couple of periods of Distribution. We are currently beginning a new (our 3rd) Accumulation Schematic in my honest opinion.
Here’s a look at the first Accumulation Schematic beginning in 2012:
Here’s a look at the second Accumulation Schematic beginning in 2015:
Here’s the third Accumulation Schematic beginning Present Day (2019):
For more information in regards to Wyckoff Schematics you can go to this link on stock charts:
I’ll follow up with more charts soon. I thought it was time to create a new publication because I believe the TREND is changing and the previous chart was getting a bit long.
News – CCN Sanctions Remove Iran from SWIFT, Will it Switch to Crypto as Planned? This week, the U.S. officially removed Iran from the Society for Worldwide Interbank Financial Telecommunication (SWIFT) network, disallowing the Central […]
After what seemed like a reversal from the strong bear market for the entire crypto-market, many bullish investors found themselves initially taking profit from what appeared to be another Double Bottom Reversal. However, when it came time to re-test the neckline, the ETH-USD market decided to continue its move down. So why did the Double Bottom Reversal, outlined in a previous , not yield the results during yesterday’s rally?
In the article referenced above, several criteria outline the price projections one can expect from a Double Bottom Reversal pattern. One of the most crucial aspect of a Double Bottom Reversal is the volume supported on the two lower peaks of the pattern. In the figure shown above, the left example of the Double Bottom pattern is support with obvious spikes in volume where the market attempted to make a new low. However, in our case, we see a pattern that looks like a Double Bottom, but lacks the required volume to really send the reversal pattern in a significant bullish rally.
So, now that we’ve failed to reverse this bear trend once again, where does this leave us in the grand scheme of things? To put this market into perspective, it is often useful to zoom out and view it on a high timescale:
One of the most notable things about this bear trend is the failure to make a new high, time and time again. Each failure to make a new high has been coupled with an increase in overall market volume, which acts an initial indicator that the market still has more bearish pressure on it. Next, if we move on to the MACD (an indicator of market momentum), we can see two things:
The current bearish period is showing no sign of divergence — each relative low made in the market is coupled with a low on the MACD histogram.
Most important, the macro bear trend shows maintained downward momentum by the way the signal line / moving average have made a new low (see the orange, dashed line).
At the time of this article, the market is finding major support and resistance levels along the Fibonacci Retracement values of the macro Bear trend (see pink notation in the image above). The fake Double Bottom Reversal propelled the market back up enough to test the 23 percent retracement value before ultimately pivoting with relative ease. On the macro scale, the next major line of support lies at our previous low: $175. It will be a hard-fought battle as this is a line of historic interest within the lifetime of the market.
As the market proceeds its march toward the bottom, the various lines of the Fibonacci Retracements will play a key role for entering and exiting positions. Most commonly, before progressing to the next Fibonacci Retracement line, the market will make a test of the resisting line above it before continuing the downward trend. The figure below outlines the recurring theme of this macro bear trend’s Fibonacci Retracement tests:
It’s entirely possible that the market won’t make it back down to to the 0 percent Fibonacci Retracement values, but, given the downward momentum outlined on several market indicators, it seems far more likely than not. With the (outlined earlier this week) on the BTC-USD markets looming in the background and testing key support levels, one can only speculate just how far the crypto-market will continue its downward move.
Summary:
A fake Double Bottom Reversal formed on the smaller timescales, trapping many people in a bullish position.
On a macro scale, the ETH-USD is maintaining its downward momentum and continues to test Fibonacci Retracement values.
Trading and investing in digital assets like bitcoin and ether is highly speculative and comes with many risks. This analysis is for informational purposes and should not be considered investment advice. Statements and financial information on bitcoin Magazine and BTCMedia related sites do not necessarily reflect the opinion of BTCMedia and should not be construed as an endorsement or recommendation to buy, sell or hold. Past performance is not necessarily indicative of future results.