Key Points
- bitcoin cash price corrected higher but it struggled to move above the $1,080-1,100 against the US Dollar.
- There is a significant bearish trend line forming with resistance at $1,000 on the 4-hours chart of the BCH/USD pair (data feed from SimpleFX).
- The pair may continue to struggle and it could decline below the $950 support in the near term.
bitcoin cash price is struggling to gain upside momentum against the US Dollar. BCH/USD remains at a risk of more losses below the $950 support.
bitcoin Cash Price Resistance
There was a minor upside recovery initiated in bitcoin cash price from the $640 swing low against the US Dollar. The price recovered above the $800 resistance and the 50% Fib retracement level of the from the $1,157 high to $640 swing low. Moreover, there was a break above the $1,000 level and the $1,020 pivot level. However, the price faced a lot of sellers near the $1,080 and $1,100 resistance levels.
More importantly, a significant bearish trend line with resistance at $1,000 on the 4-hours chart of the BCH/USD pair also acted as a hurdle. Lastly, the price failed to move above the 76.4% Fib retracement level of the last drop from the $1,157 high to $640 swing low. At the moment, the price is and is trading below the $1,000 level and the 100 simple moving average (4-hours). As long as the price is below the $1,000 level and the 100 SMA, it remains at a risk.
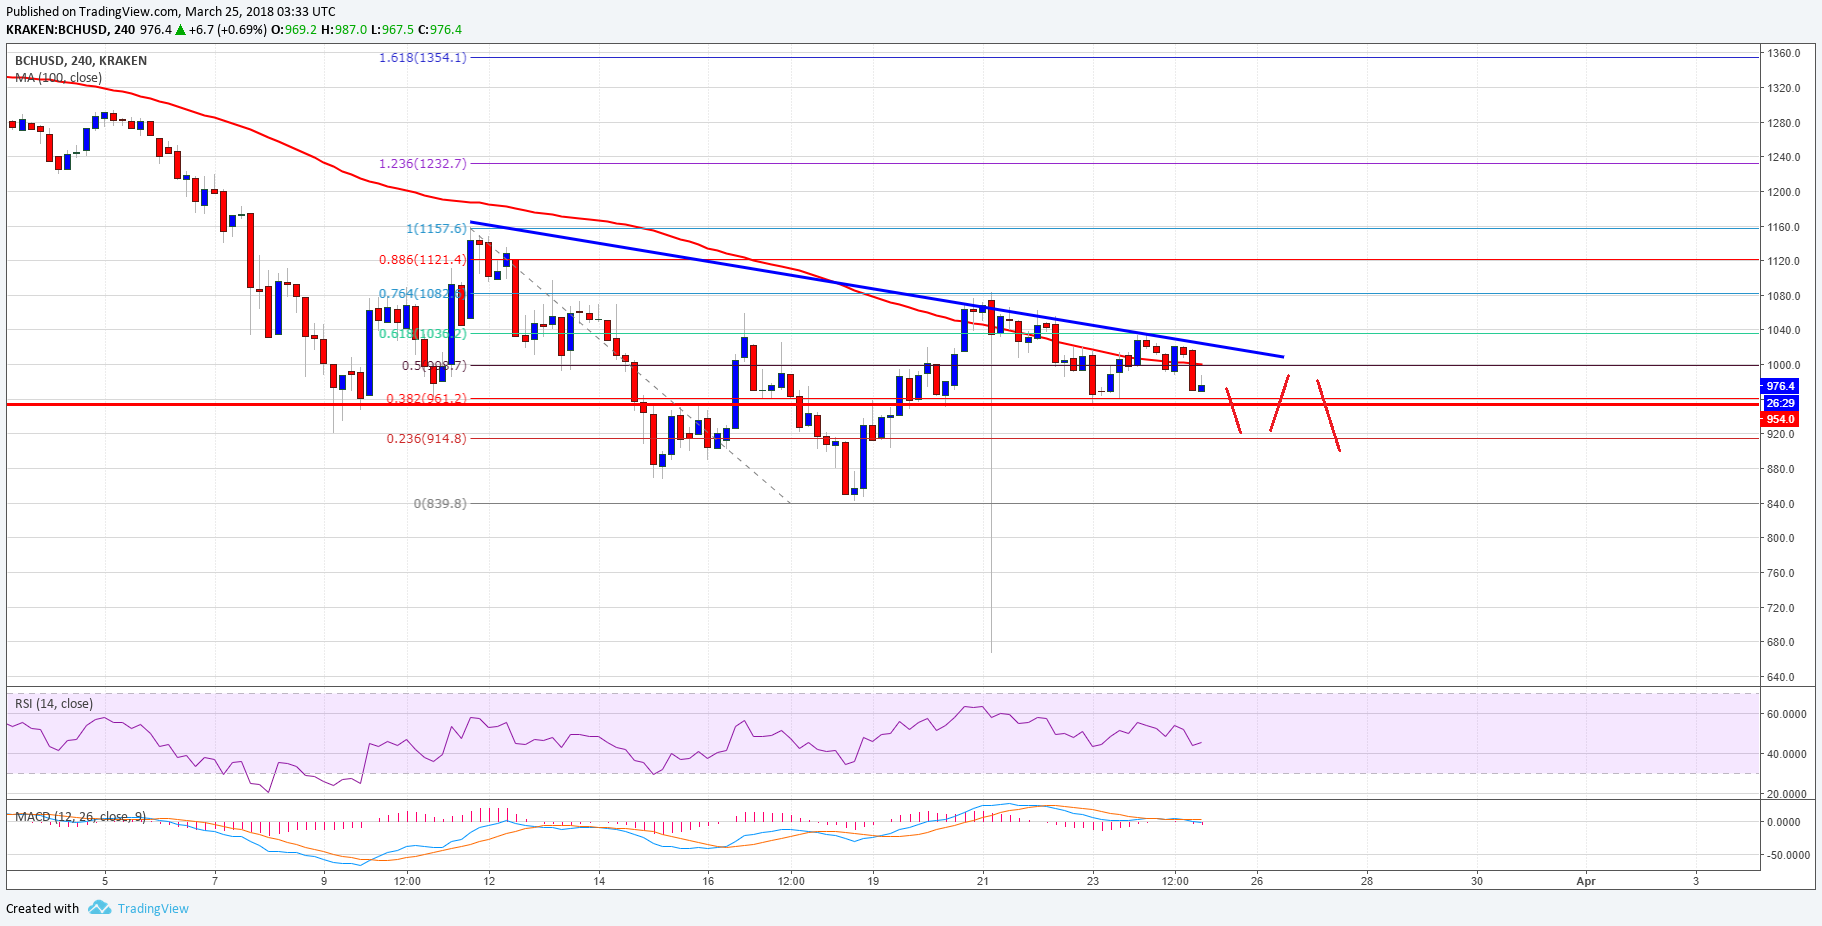
On the downside, the $950 level is a crucial support. If the price drops below the mentioned $950 support, it could move back in the bearish zone in the near term.
Looking at the technical indicators:
4-hours MACD – The MACD for BCH/USD is moving back in the bearish zone.
4-hours RSI (Relative Strength Index) – The RSI for BTC/USD is now well below the 50 level.
Major Support Level – $950
Major Resistance Level – $1,000
Charts courtesy –
Published at Sun, 25 Mar 2018 04:08:52 +0000
Analysis
