Key Points
- bitcoin cash price surged higher and broke the $1,550 and $1,700 resistance levels against the US Dollar. There is a crucial bullish trend line forming with support near $1,680 on the 4-hours chart of the BCH/USD pair (data feed from Kraken).
- The pair may correct a few points, but it remains supported above $1,650 in the near term.
bitcoin cash price broke the $1,700 barrier against the US Dollar. BCH/USD is likely to accelerate higher as long as it stays above the $1,650 support.
bitcoin Cash Price Support
There were in bitcoin cash price from the $1,450 swing low against the US Dollar. The price surged higher and broke many barriers such as $1,500, $1,550 and $1,700. It even cleared the $1,800 hurdle and traded as high as $1,838 recently. The current price action is super bullish and it seems like the price may perhaps continue to grind higher towards $1,900 in the near term.
At the moment, the price is correcting lower and is trading below $1,800. However, there are many supports on the downside, starting with $1,750. The 23.6% Fib retracement level of the last wave from the $1,229 low to $1,838 high is also at $1,694 to . More importantly, there is a crucial bullish trend line forming with support near $1,680 on the 4-hours chart of the BCH/USD pair. The most significant support is positioned above the $1,600 level. Additionally, the 38.2% Fib retracement level of the last wave from the $1,229 low to $1,838 high is at $1,605.
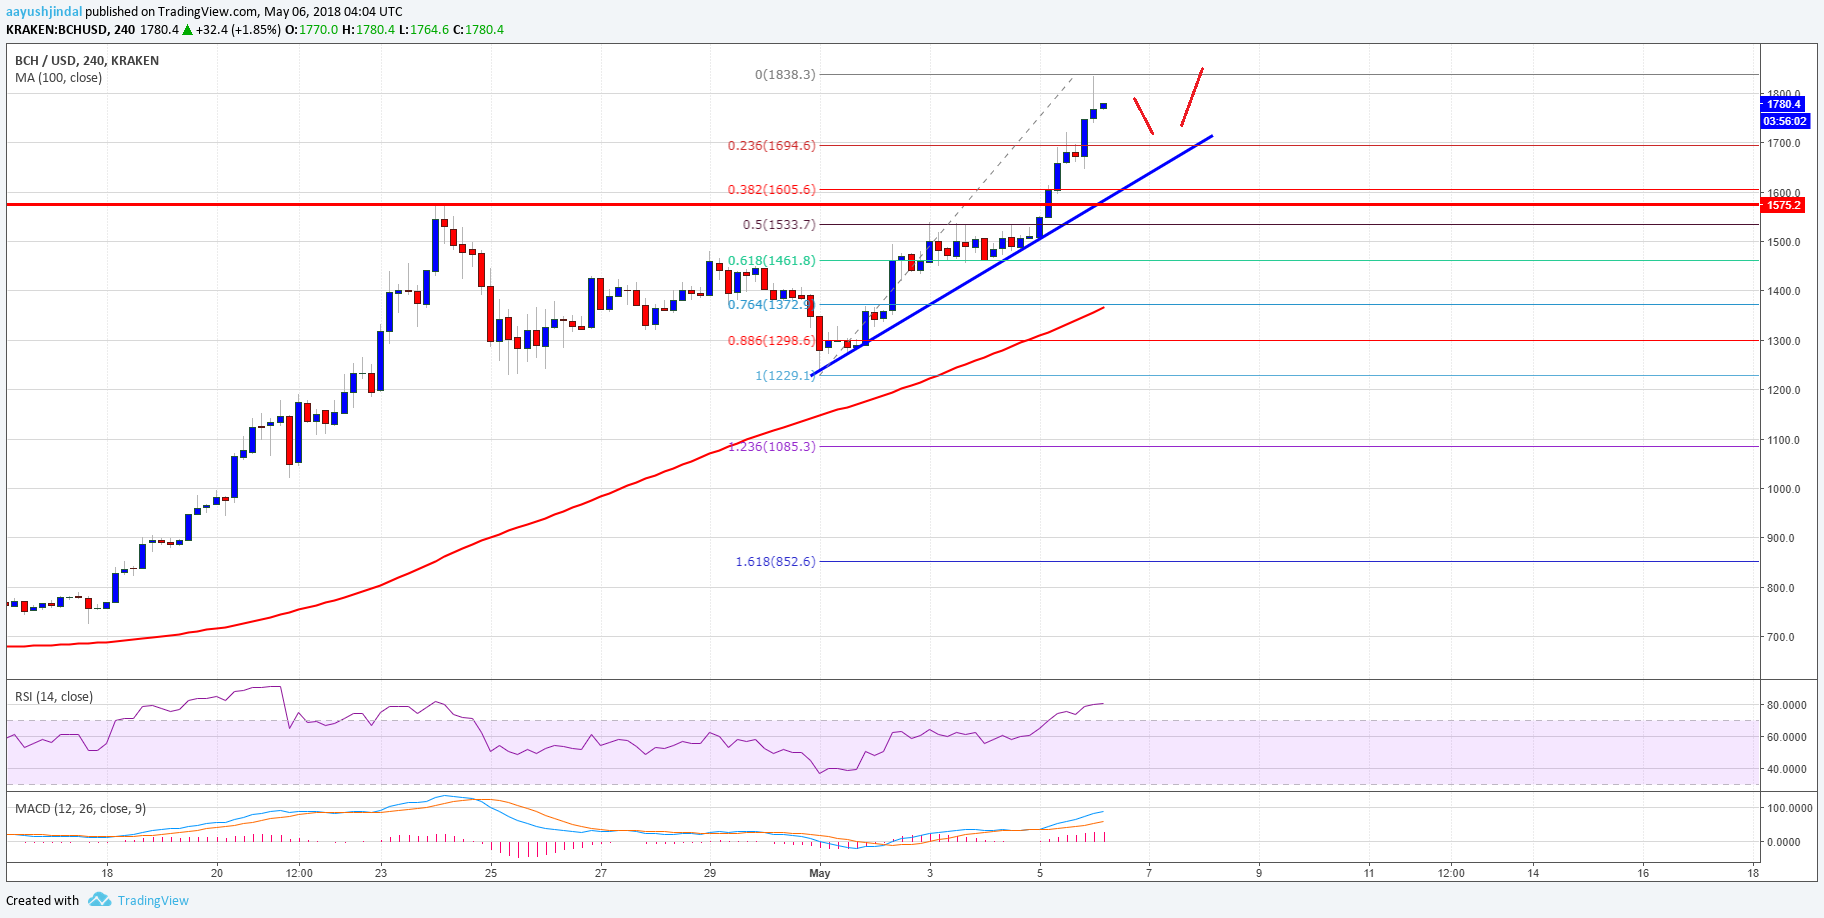
Looking at the , if the price corrects lower, the $1,650-1,680 zone is likely to act as a strong buy zone. On the upside, a break above the recent high of $1,838 could push the price above $1,900.
Looking at the technical indicators:
4-hours MACD – The MACD for BCH/USD is gaining momentum in the bullish zone.
4-hours RSI (Relative Strength Index) – The RSI for BTC/USD is in the overbought zone.
Major Support Level – $1,650
Major Resistance Level – $1,900
Published at Sun, 06 May 2018 04:28:39 +0000
Analysis