Key Points
- bitcoin cash price extended its downside move and traded below the $1,350 support against the US Dollar.
- Yesterday’s highlighted crucial bullish trend line with support near $1,355 was breached on the hourly chart of the BCH/USD pair (data feed from Kraken).
- The pair is now consolidating losses above the $1,240 level and it remains at a risk of more declines.
bitcoin cash price moved down further below $1,300 against the US Dollar. BCH/USD broke a key support and it may now extend its decline in the near term.
bitcoin Cash Price Resistance
There was a started from the $1,574 high in bitcoin cash price against the US Dollar. The price declined and broke many supports yesterday near $1,400 and $1,360. More importantly, there was a break below the $1,350 pivot level, which ignited further gains. BCH sellers even succeeded in pushing the price below $1,300 and the 100 hourly simple moving average.
The trend change move was a break below yesterday’s highlighted crucial bullish trend line with support near $1,355 on the hourly chart of the BCH/USD pair. The pair traded as low as $1,232 and is currently consolidating losses. On the upside, an initial resistance is near $1,320 and the 100 hourly simple moving average. The next resistance is near the 38.2% Fib retracement level of the last drop from the $1,574 high to $1,232 low at $1,360. The stated $1,360 level was a and now it may prevent upsides.
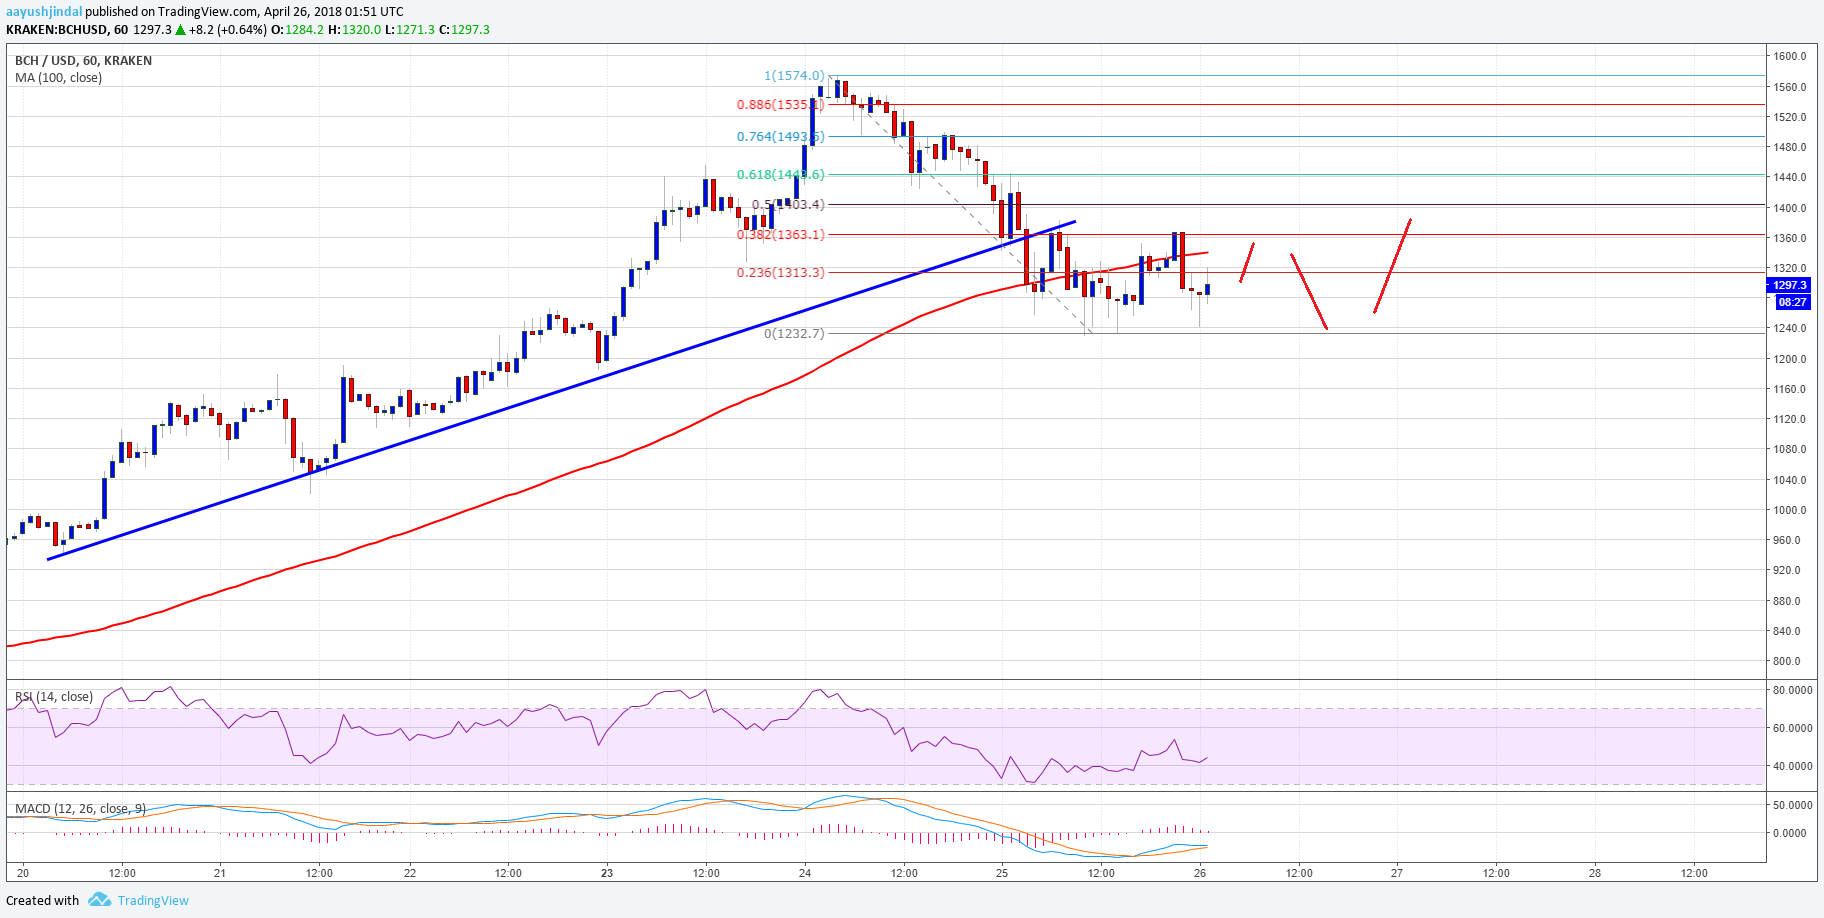
Looking at the , it seems like the price may consolidate around $1,300 for some time. There is a chance of a downside spike towards $1,200 before the price makes an upside move. On the upside, a break above $1,360-1,400 is needed for a test of $1,500.
Looking at the technical indicators:
Hourly MACD – The MACD for BCH/USD is mostly in the bearish zone.
Hourly RSI (Relative Strength Index) – The RSI for BCH/USD is now below the 50 level.
Major Support Level – $1,200
Major Resistance Level – $1,360
Published at Thu, 26 Apr 2018 03:18:40 +0000
Analysis

