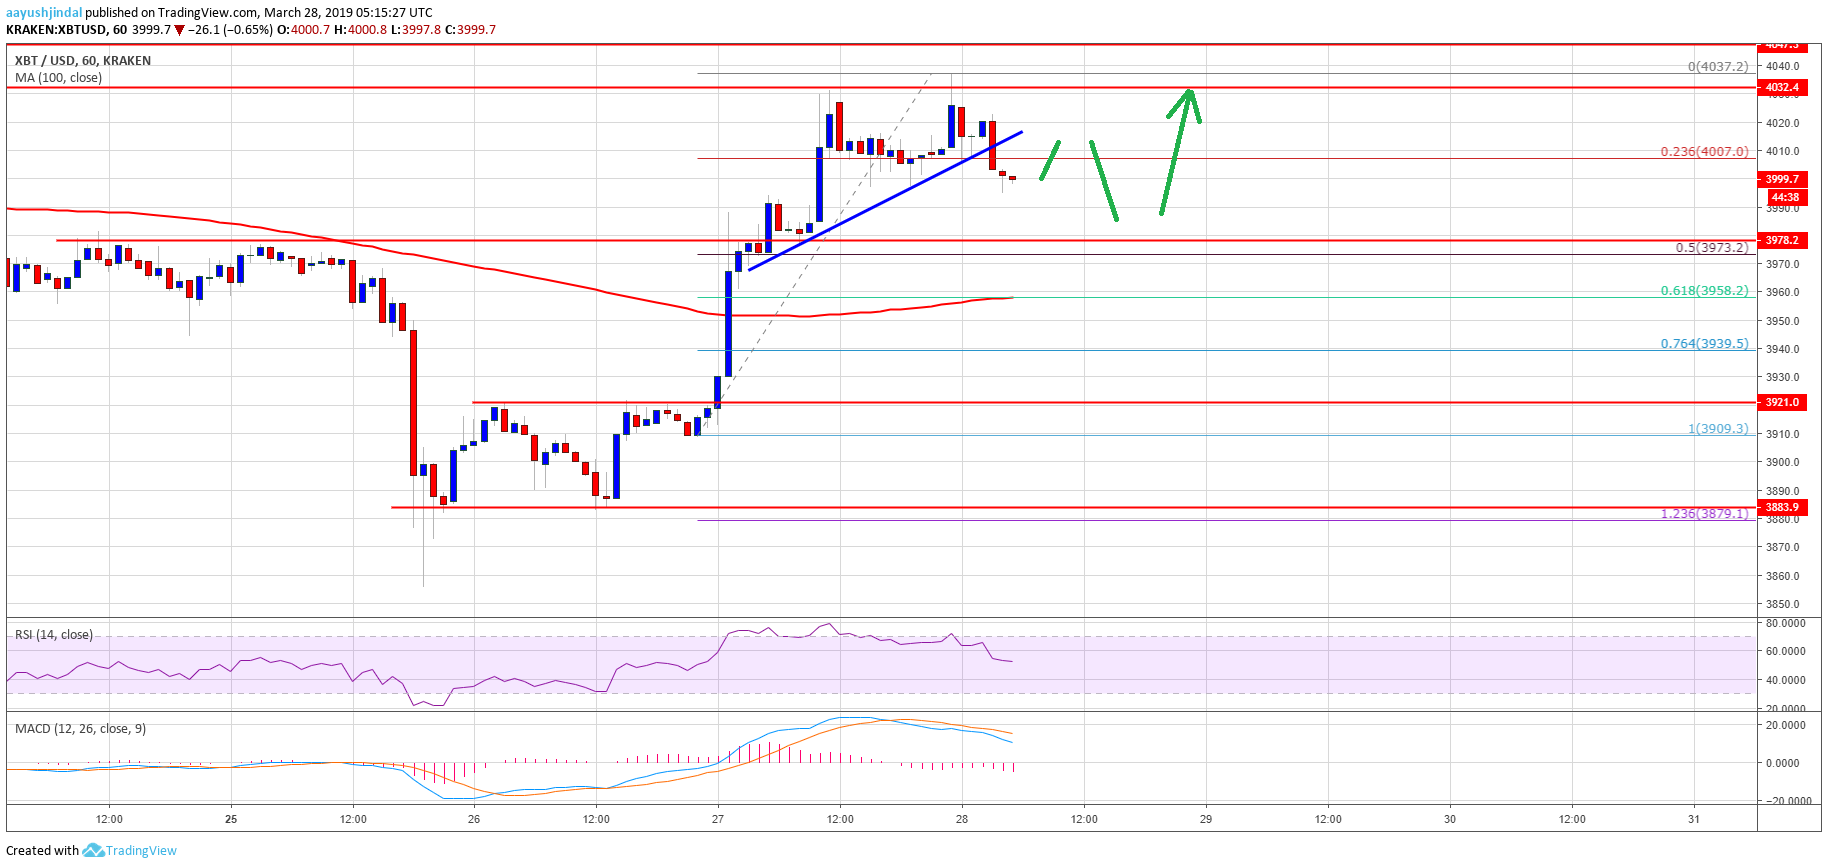
- bitcoin price extended gains above the $4,000 level and tested $4,040 against the US Dollar.
- The price started a downside correction after trading as high as $4,037.
- There was a break below a short term bullish trend line with support at $4,015 on the hourly chart of the BTC/USD pair (data feed from Kraken).
- The pair might correct lower, but dips remain attractive to buyers near the $3,970 support area.
bitcoin price traded with a bullish bias above the $4,000 level against the US Dollar. BTC is currently correcting lower, but dips are likely to find a strong buying interest near $3,970 or $3,940.
bitcoin Price Analysis
Yesterday, we saw a solid rise in bitcoin price above the against the US Dollar. The BTC/USD pair even broke the $4,000 resistance and settled above the 100 hourly simple moving average. The upward move was strong as the price climbed above the $4,020 resistance level. A new weekly high was formed at $4,037 and later the price started a downside correction. It traded below the $4,020 and $4,010 support levels.
Besides, there was a break below a short term bullish trend line with support at $4,015 on the hourly chart of the BTC/USD pair. The pair surpassed the 23.6% Fib retracement level of the recent wave from the $3,909 low to $4,037 high. However, there are many supports on the downside near the $3,980 and $3,970 levels. Besides, the 50% Fib retracement level of the recent wave from the $3,909 low to $4,037 high is also near the $3,973 level. If there are , the next key support is near the $3,660 level.
The $3,660 can be a pivot level since it is the 61.8% Fib retracement level of the recent wave from the $3,909 low to $4,037 high. On the upside, the $4,020 level is an initial resistance for buyers. A clear break above $4,020 may open the doors for a push above the $4,040 and $4,050 resistance levels.
Looking at the , bitcoin price is placed nicely in an uptrend above the $3,970 and $3,960 support levels. Any further losses may push the price back in a bearish zone towards the $3,920 support. An intermediate support is near the $3,940 level, which was a key resistance earlier. Overall, the current technical structure is positive and there are chances of more gains once the current correction is complete near $3,970 or $3,960.
Technical indicators:
Hourly MACD – The MACD is slowly gaining pace in the bearish zone.
Hourly RSI (Relative Strength Index) – The RSI for BTC/USD is currently correcting lower towards the 50 level.
Major Support Levels – $3,970 followed by $3,960.
Major Resistance Levels – $4,010, $4,020 and $4,040.
Published at Thu, 28 Mar 2019 06:30:45 +0000