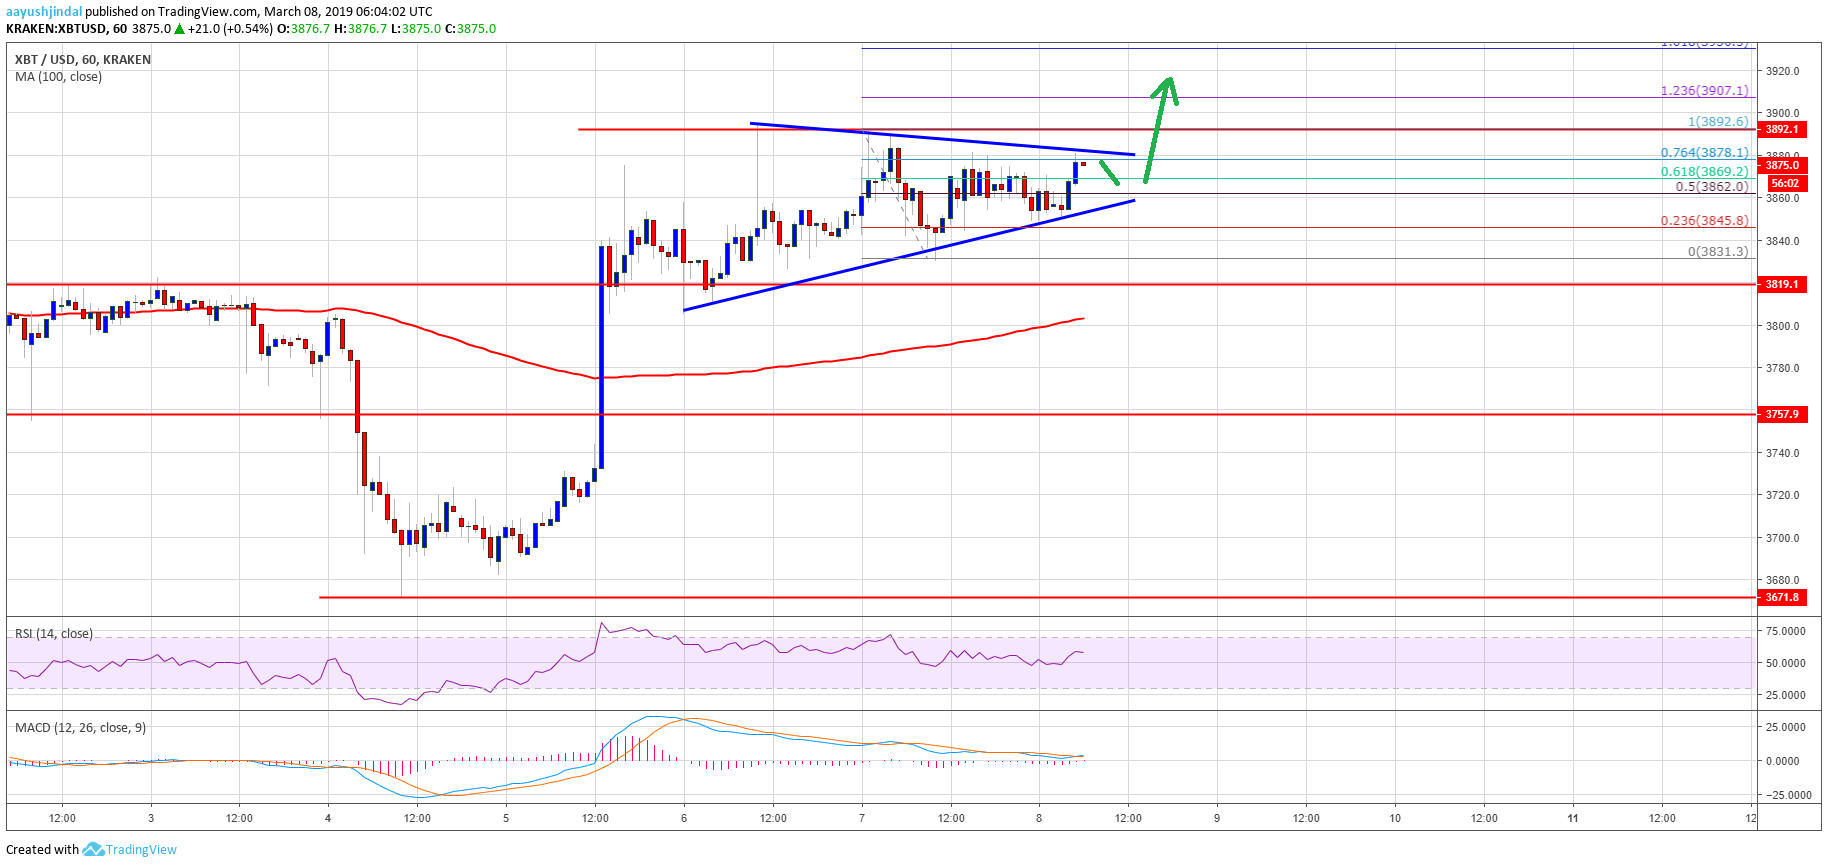
- bitcoin price is currently consolidating above the $3,820 and $3,840 supports against the US Dollar.
- The price placed in a positive zone, with a bullish angle towards the $4,000 resistance.
- There is a symmetrical triangle pattern formed with resistance at $3,880 on the hourly chart of the BTC/USD pair (data feed from Kraken).
- The pair will most likely break the $3,880 and $3,900 resistance levels to climb above or challenge $4,000.
price is forming a bullish breakout pattern above the $3,800 support against the US Dollar. could surge above the $3,900 and $4,000 resistance levels in the near term.
bitcoin Price Analysis
After a strong upward move above the $3,850 level, price started against the US Dollar. The /USD pair tested the $3,900 resistance on a couple occasions and later corrected lower. It declined below the $3,850 level, but downside were limited. The last swing low was formed at $3,831 before the price recovered above $3,840. There was a break above the 50% Fib retracement level of the recent slide from the $3,892 high to $3,831 low.
However, the price is currently facing a strong resistance near the $3,880 and $3,890 levels. Besides, the 76.4% Fib retracement level of the recent slide from the $3,892 high to $3,831 low is acting as a resistance. More importantly, there is a symmetrical triangle pattern formed with resistance at $3,880 on the hourly chart of the /USD pair. Therefore, it seems like the pair is setting up for the next break, which could be above $3,880. If there is a successful close above $3,880 and $3,900, the towards the $4,000 resistance level.
An intermediate resistance is near the $3,930 level. It represents the 1.618 Fib extension level of the recent slide from the $3,892 high to $3,831 low. On the other hand, if the price fails to gain pace above $3,900, it could decline below the $3,850 support. The next main support is near the $3,820 level. If there are further losses, the price may perhaps test the $3,800 support and the 100 hourly simple moving average.
Looking at the , price is preparing for the next ride either above $3,900 or below $3,800. There are higher chances of a break above $3,900 and $3,930 considering the current structure. If buyers remain in action, the price could even clear the $4,000 barrier in the coming sessions.
Technical indicators
Hourly MACD – The MACD is about to move back in the bullish zone.
Hourly RSI (Relative Strength Index) – The RSI for /USD is placed well above the 50 level, with a positive angle.
Major Support Level – $3,820 followed by $3,800.
Major Resistance Level – $3,880, $3,900 and 4,000.
Published at Fri, 08 Mar 2019 06:51:01 +0000