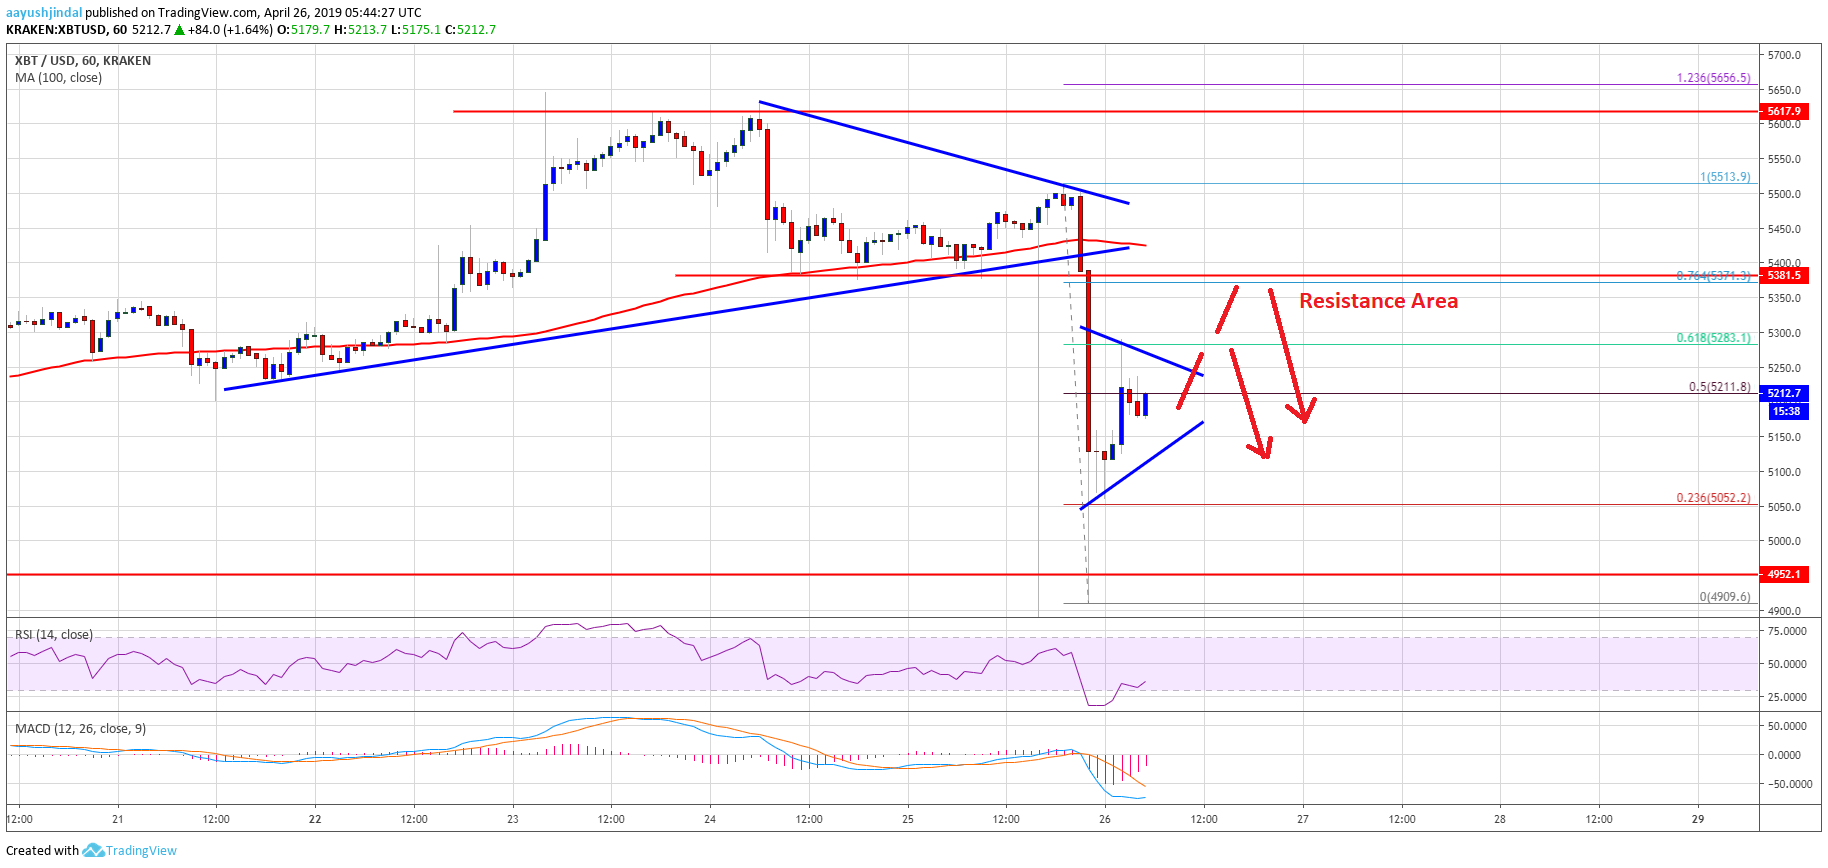
- bitcoin price declined sharply after it broke the key $5,400 and $5,380 supports against the US Dollar.
- The price even broke the $5,000 support level and tested the $4,900 support area.
- There was a break below a major bullish trend line with support at $5,410 on the hourly chart of the BTC/USD pair (data feed from Kraken).
- The pair must climb back above $5,400 to avoid a fresh drop towards the $5,000 support area.
price declined heavily below $5,400 and $5,250 against the US Dollar. is currently correcting higher, but it is likely to face a strong selling interest near $5,250 and $5,380.
bitcoin Price Analysis
The past two sessions were eventful since there were heavy moves in price below $5,400 against the US Dollar. After consolidating for a few hours above , the /USD pair started a strong decline. There were two nasty red candles formed and the price broke the $5,250 and $5,120 support levels. The decline started after there was a break below a major bullish trend line with support at $5,410 on the hourly chart.
The pair settled below the $5,250 level and the 100 hourly simple moving average. Sellers took control and pushed the price below the $5,000 support as well. A new weekly swing low as formed at $4,909 and the price is currently correcting higher. It already moved above the 50% Fib retracement level of the recent decline from the $5,513 high to $4,909 swing low. However, the $5,280 level acted as a . Besides, the 61.8% Fib retracement level of the recent decline from the $5,513 high to $4,909 swing low also stopped gains.
At the moment, the price is consolidating near $5,180, with hurdles near $5,250, $5,280 and $5,300. Above $5,300, the main resistance is near the $5,380 level (the previous support). To start a strong upward move, the price must climb back above $5,400a and the 100 hourly simple moving average. If continues to struggle near the $5,300 and $5,380 levels, it could resume its decline.
Looking at the , price clearly moved into a bearish zone below $5,380 and the 100 hourly simple moving average. It could correct in the short term, but sellers are likely to defend the $5,380-5,400 zone. On the downside, the price could revisit the $5,000 support area if it breaks the $5,120 support.
Technical indicators:
Hourly MACD – The MACD is slowly reducing its bearish slope, with no positive sign.
Hourly RSI (Relative Strength Index) – The RSI for /USD recovered from the 20 level and it is currently near 30.
Major Support Levels – $5,120 followed by $5,000.
Major Resistance Levels – $5,250, $5,380 and $5,400.
Published at Fri, 26 Apr 2019 07:11:34 +0000