- bitcoin price started a fresh increase after forming a support base above $6,900 against the US Dollar.
- The price gained bullish momentum above $7,400 and settled above the key $7,650 pivot level.
- There is a major bullish trend line forming with support near $7,610 on the hourly chart of the BTC/USD pair (data feed from Kraken).
- The pair remains well supported on the downside above $7,600 and it could soon break $8,200.
bitcoin price is positioned nicely in the positive zone above $7,600 against the US Dollar. BTC could correct in the short term, but dips remain supported near $7,760 and $7,650.
bitcoin Price Analysis
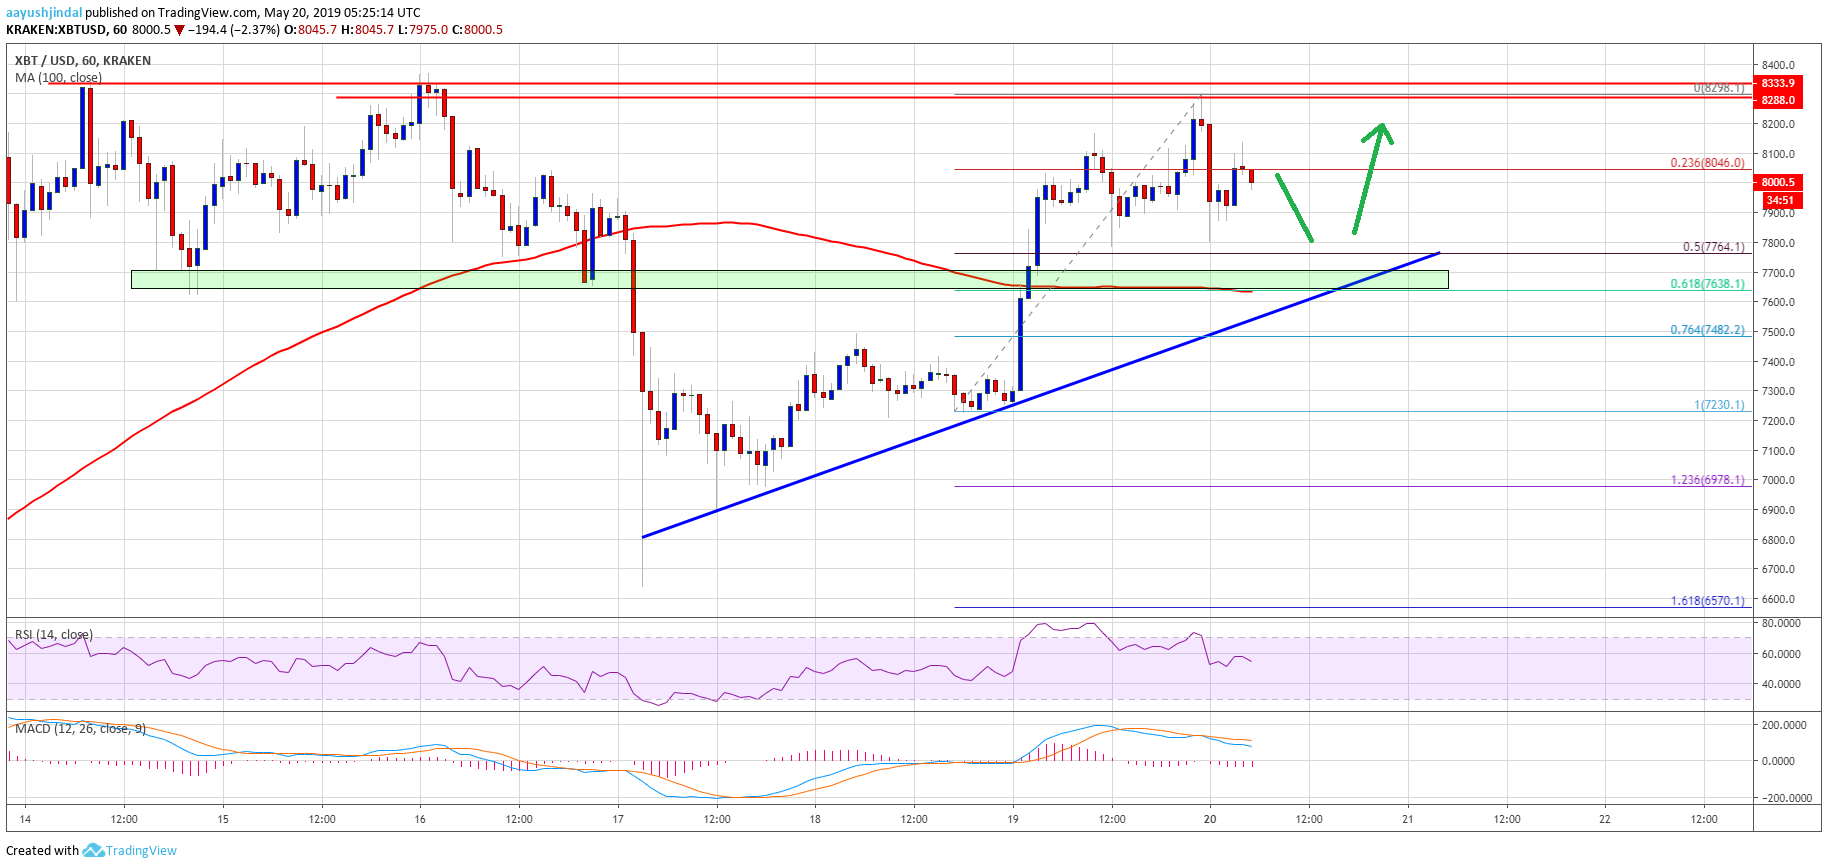
Recently, bitcoin price formed a strong support near the $7,250 level against the US Dollar. The BTC/USD pair from the $7,230 swing low and climbed above the $7,400 resistance level. The recent upward move was such that the price even climbed above the $7,500 resistance and the 100 hourly simple moving average. Finally, there was a clear break above the $8,000 resistance level. The price tagged the main $8,280 resistance level and recently corrected below the $8,150 level.
There was a break below the 23.6% Fib retracement level of the last wave from the $7,230 low to $8,288 swing high. However, the $7,800 level is acting as a strong buy zone. Moreover, the 50% Fib retracement level of the last wave from the $7,230 low to $8,288 swing high is also near the $7,764 level to provide support. More importantly, there is a major bullish trend line forming with support near $7,610 on the hourly chart of the BTC/USD pair. It seems like there is a forming near $7,610 and the 100 hourly SMA.
Besides, the 61.8% Fib retracement level of the last wave from the $7,230 low to $8,288 swing high is also near the $7,640 level. Therefore, if the price corrects lower from the current levels, the $7,760 and $7,650 levels are likely to act as strong supports. If there is a downside break below the $7,600 support zone, the price might move back in a bearish zone.
Looking at the , bitcoin price is currently trading with a positive bias above the $7,650 support. As long as the price is above $7,600, it is likely to continue higher towards $8,200 and $8,300. A clear break above the $8,300 resistance may perhaps clear the path for more gains above $8,400.
Technical indicators:
Hourly MACD – The MACD is slowly moving in the bearish zone.
Hourly RSI (Relative Strength Index) – The RSI for BTC/USD is moving lower, but it is well above the 50 level.
Major Support Levels – $7,760 followed by $7,650.
Major Resistance Levels – $8,150, $8,200 and $8,300.
Published at Mon, 20 May 2019 06:00:45 +0000