- bitcoin price is facing a strong resistance near the $5,150 and $5,160 levels against the US Dollar.
- The price must break the $5,160 and $5,200 levels to start a strong rebound.
- There is a major bearish trend line forming with resistance near $5,160 on the hourly chart of the BTC/USD pair (data feed from Kraken).
- The pair is likely preparing for the next break either above $5,200 or towards $4,950.
bitcoin price is trading near a couple of important hurdles against the US Dollar. BTC seems to be preparing for the next move either above the $5,200 resistance or below $5,100.
bitcoin Price Analysis
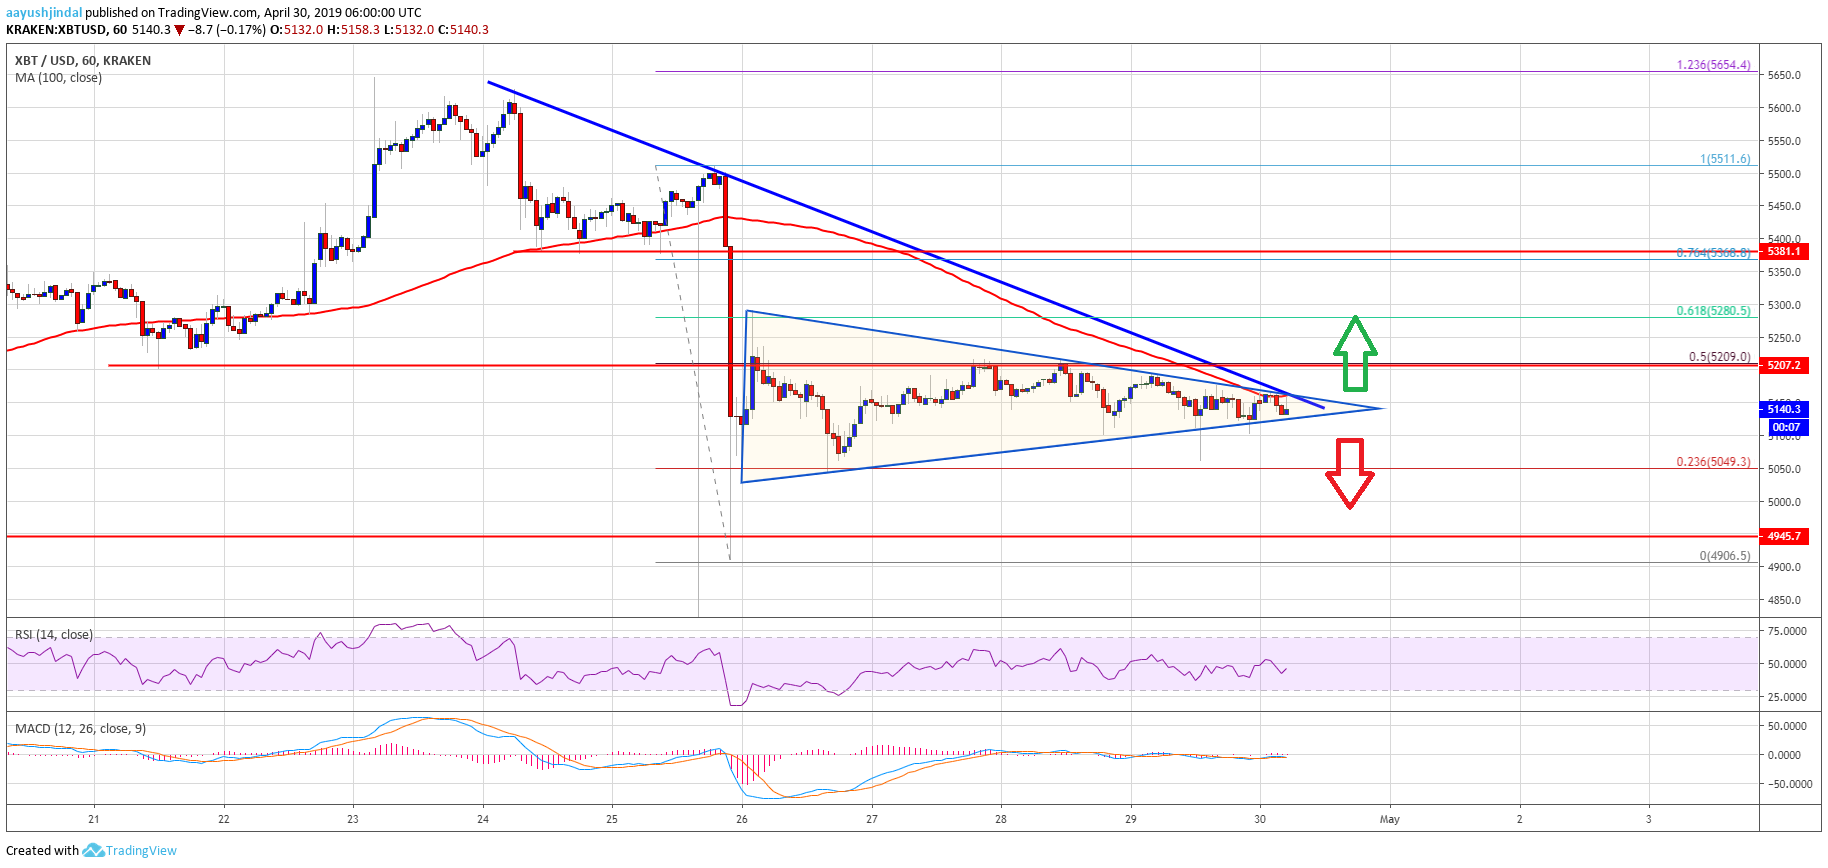
In the past three sessions, there were range moves in bitcoin price below the against the US Dollar. Earlier, the BTC/USD pair formed a decent support above the $5,000 and $5,020 levels. It recovered above the $5,050 level and the 23.6% Fib retracement level of the downward move from the $5,511 high to $4,906 low. The price even broke the $5,200 level, but it failed to retain strength. There were a couple of attempts to clear $5,210 and $5,220, but the bulls failed.
The price also failed near the 50% Fib retracement level of the downward move from the $5,511 high to $4,906 low. Besides, the 100 hourly simple moving average is currently preventing gains above the $5,160 level. There is also a major bearish trend line forming with resistance near $5,160 on the hourly chart of the BTC/USD pair. More importantly, there is a contracting triangle in place with resistance near $5,160. Therefore, an above the $5,160 level may clear the path for more gains above $5,200.
The next resistance above $5,200 is at $5,280. It represents the previous support and the 61.8% Fib retracement level of the downward move from the $5,511 high to $4,906 low. On the other hand, if there is a downside break below $5,120 and $5,100, there could be sharp declines in the near term. The next support is at $5,050, below which the price could revisit the $4,950 support.
Looking at the , bitcoin price is trading with a positive bias above $5,120. However, a convincing break above $5,160 and $5,200 is must for more upsides. If the bulls continue to struggle, there could be a fresh decline below $5,120 and $5,100. In the mentioned bearish case, the price could struggle to bounce back in the near term.
Technical indicators:
Hourly MACD – The MACD is mostly flat in the bullish zone, with a few positive signs.
Hourly RSI (Relative Strength Index) – The RSI for BTC/USD is currently below 50, with no bearish sign.
Major Support Levels – $5,120 followed by $5,100.
Major Resistance Levels – $5,160, $5,200 and $5,280.
Published at Tue, 30 Apr 2019 06:30:57 +0000