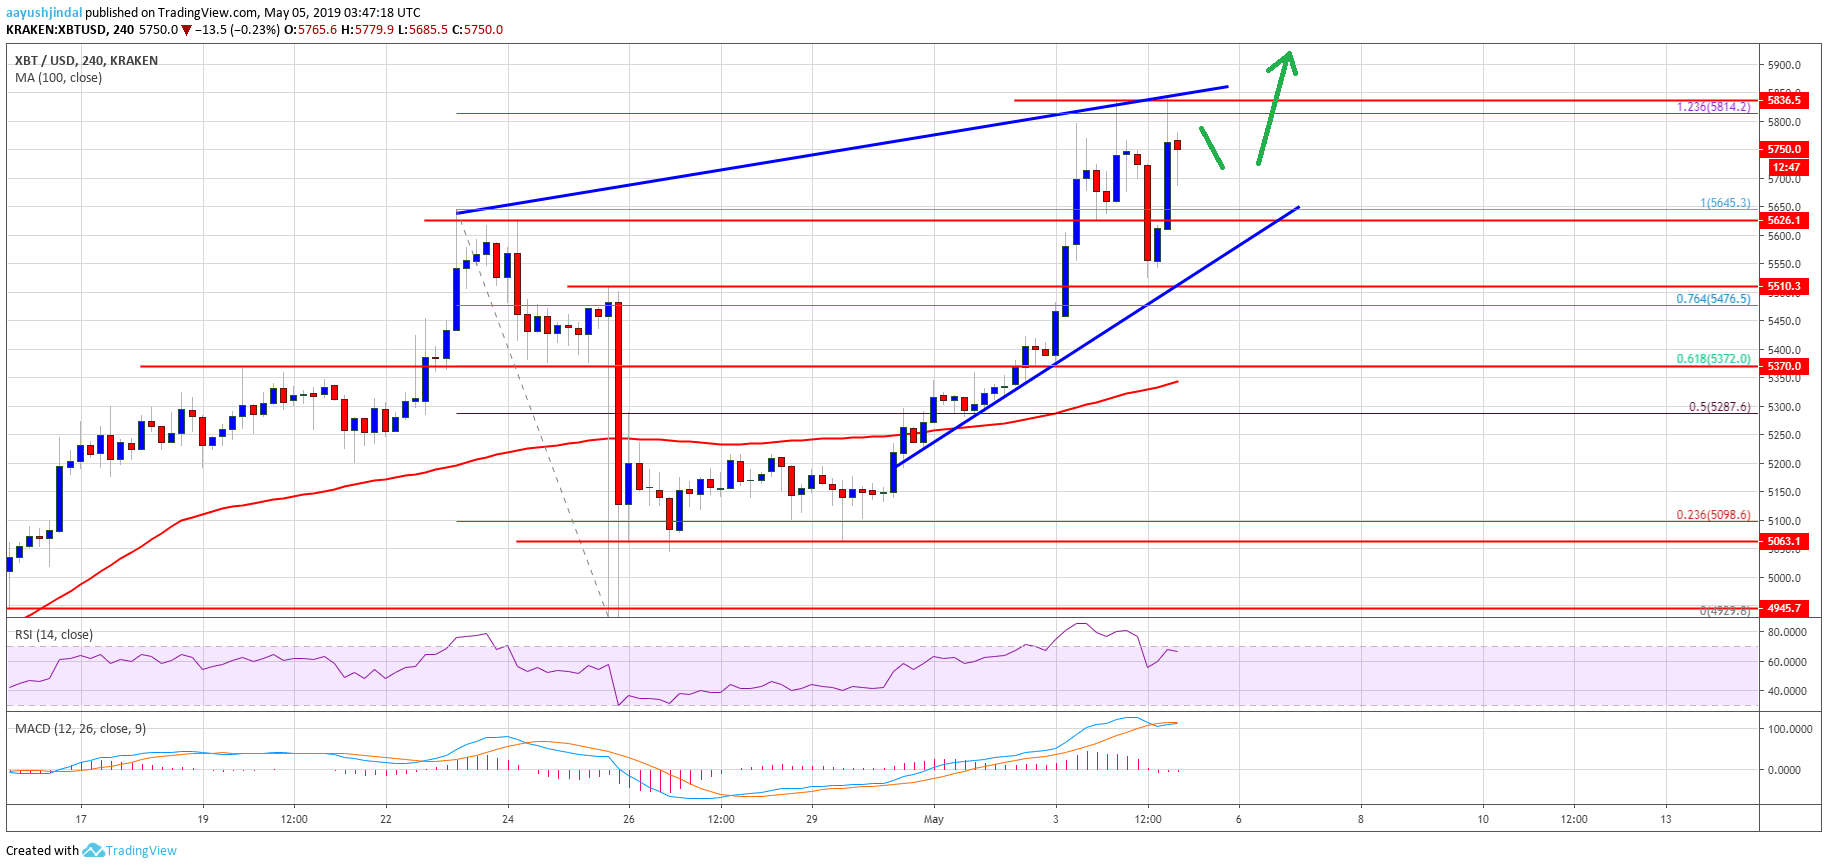
- There were heavy gains in bitcoin price above the $5,500 pivot and resistance level against the US Dollar.
- The price rallied above the $5,700 and $5,800 resistance before there was a minor downside correction.
- There is a key connecting bullish trend line in place with support at $5,610 on the 4-hours chart of the BTC/USD pair (data feed from Kraken).
- The pair is currently in a strong uptrend and it could trade towards the main $6,500 resistance level.
bitcoin price gained significantly above the $5,600 level against the US Dollar. BTC is likely to break the $6,000 and $6,250 levels before it could start a substantial downside correction.
bitcoin Price Weekly Analysis (BTC)
This past week, there was a in bitcoin price above the $5,380 and $5,400 resistances against the US Dollar. The BTC/USD pair broke the $5,500 pivot and resistance level to move into a bullish zone. The bulls gained traction, resulting in a push above the $5,600 and $5,700 resistance levels. There was a clear break above the 76.4% Fib retracement level of the major drop from the $5,645 high to $4,929 swing low. The price settled well above the $5,600 level and the 100 simple moving average (4-hours).
Finally, the price broke the $5,700 level and the last swing high. A new 2019 high was formed near $5,838 before the price started a downside correction. It seems like the price faced a strong resistance near the $5,820-5,840 zone. It represents the 1.236 Fib extension level of the major drop from the $5,645 high to $4,929 swing low. The price corrected below the $5,700 level, but dips remain well supported (). As a result, there was a strong comeback and the price surged back above $5,700 and $5,750.
The price is still trading below the last swing high and resistance near $5,820-5,840. A convincing break above the $5,820-5,840 zone is likely to set the pace for more upsides above $6,000. The price could even break the $6,250 level and trade towards the main hurdles at $6,400 and $6,500. It won’t be easy for the bulls to clear the $6,500 level since it is a major pivot zone and previous support area. Therefore, there are high chances of a major downside correction if the price test $6,400 or $6,500.
Looking at the , bitcoin price is clearly placed in a strong uptrend above $5,600. There is also a key connecting bullish trend line in place with support at $5,610 on the same chart. Therefore, dips could still be contained and the price could rally above $6,000.
Technical indicators
4 hours MACD – The MACD for BTC/USD is about to move back in the bullish zone.
4 hours RSI (Relative Strength Index) – The RSI for BTC/USD is placed well above the 50 and 60 levels.
Major Support Level – $5,600
Major Resistance Level – $5,850
Published at Sun, 05 May 2019 05:00:46 +0000