September 24, 2026

Capitalizations Index – B ∞/21M

Argentinian Bank Drops Out of SWIFT, Favors Bitcoin and Cryptocurrency

Argentinian bank drops out of swift, favors bitcoin and cryptocurrency

Argentinian Bank Drops Out of SWIFT, Favors Bitcoin and Cryptocurrency


Argentina
Advertisement

Join our community of 10 000 traders on Hacked.com for just $39 per month.

According to Toshi Times, Jose Dakak, the principal shareholder of Argentinian bank Banco Masventas, has stated that the bank will drop out from the global financial network SWIFT and begin utilizing the bitcoin blockchain network to settle international payments.

Can bitcoin Replace SWIFT?

Through a strategic partnership with Bitex, a cryptocurrency payment service provider based in South America, Dakak explained that the bank will outsource the conversion process of bitcoin to fiat currencies to Bitex, which will then send bitcoin to the recipient. The end cost would be the bitcoin transaction fee that is sent to the miners that verify transactions on the blockchain and the fee charged by Bitex.

“The service allows you to reduce costs associated with international transfers as there are no international banks as intermediaries,” said Banco Masventas.

Dakak noted that one of the initial actions the bank took to streamline the implementation process of bitcoin was to cooperate with the Bitex development team to ensure recipients of bitcoin payments can seamlessly receive cryptocurrency transactions without boundaries. Dakak stated:

“One of the actions was to contract Bitex as a strategic partner in the implementation of the Bitex platform for payments and collections operations for our clients abroad.”

The SWIFT network, which is utilized by the world’s biggest banks and financial institutions, is essentially a messaging network that enables banks to share information. Sending a payment from one bank to another requires a message to be sent on the SWIFT network, which has to be verified manually.

Sending international payments and remittance transactions on the SWIFT network can take at least five business days to three weeks, depending on the size of the payment. Because most international payments processed by banks are large, it often takes more than a week for the payment to be cleared.
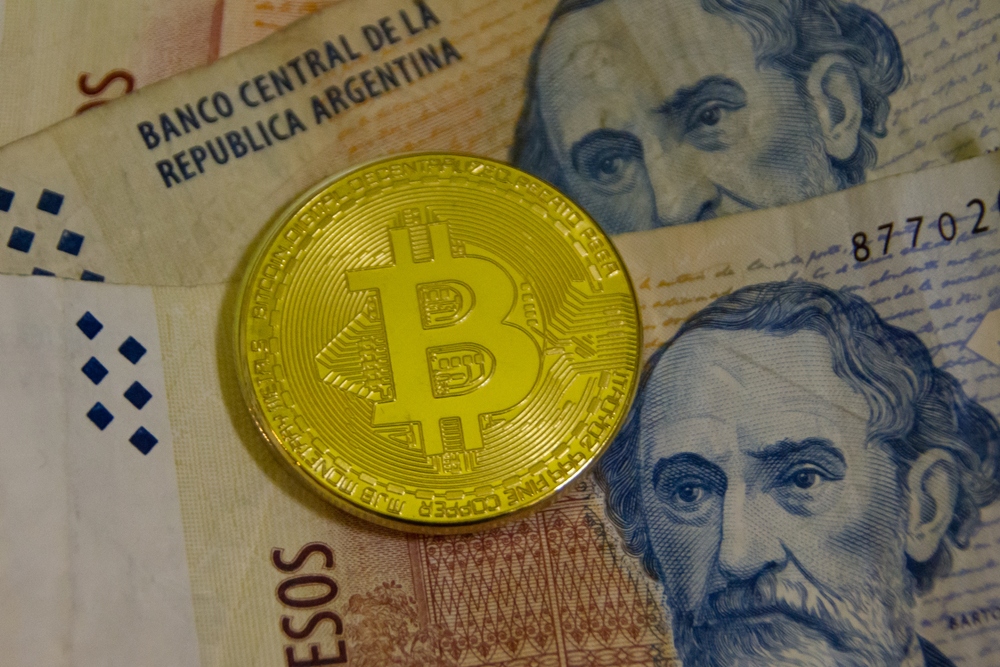
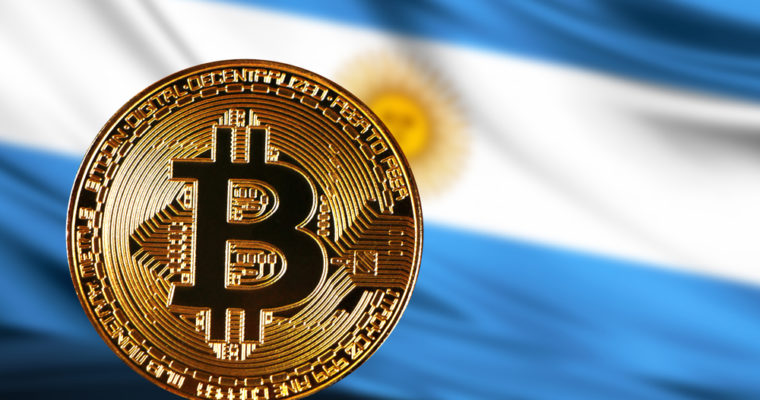
Argentina bitcoin
Source: shutterstock

bitcoin is not the most flexible blockchain network and it does not have the biggest capacity. But, it is the most robust blockchain protocol with the longest track record, equipped with one of the most active open-source development groups in the industry. Its transparency and security allow the bitcoin network to operate as a reliable financial network for international payments.

Moreover, most international payments sent by banks, as stated above, are often large transactions that cannot be processed by remittance outlets. Although bitcoin transaction fees could be an issue for $1 to $10 payments, for payments above $1,000, the bitcoin transaction fee is a non-issue.

Why is SWIFT Still Used?

The SWIFT network is not only operated by leading banks by owned by the world’s biggest financial institutions. As such, even though the SWIFT network is outdated and utilizes an inferior technology, banks have the obligation to use it. That is, until minor banks like Bank Masventas opt out of the SWIFT network and begin to leverage public financial networks like bitcoin, which are completely decentralized and peer-to-peer.

Other banks have started to pilot blockchain protocols like Ripple and Ethereum to process international payments, which could be crucial in demonstrating the potential of cryptocurrency as an alternative to the global finance sector in the long-term.

Images from Shuttertsock

Follow us on Telegram.
Advertisement

Published at Wed, 23 May 2018 23:05:42 +0000

Banking
Previous Article

Funny Cool n Rude Crypto T-Shirt | Bitcoin Shirt | Ethereum Shirt | Cryptocurrency | Hodl | Gift Idea

Next Article

ADCOIN – HOLLANDSE GLORIE OF ONDERGANG!

You might be interested in …

Bitcoin Price Analysis: Post-Fork Exuberance Shows No Signs of Pulling Back (Yet)

Bitcoin Price Analysis

Remember that time I said BTC-USD likely won’t see a new all time high (ATH) any time soon? Looks like I was wrong. Shortly after posting my previous BTC-USD analysis, in a matter of one hour, the price of BTC-USD not only broke its record high, but it surpassed it by $200 after ultimately settling in the $3200s. As of this morning, BTC-USD pushed another ATH of $3440 on Bitfinex marking a $600+ in less than a week. Let’s take a look at what these moves can possibly mean for BTC-USD and if these moves are sustainable.

Starting in the $160s, BTC-USD has been on a massive, multi-year bull run:

Figure_1 (3).JPGFigure 1: BTC-USD, 3 Day Candles, Bitfinex, Macro Bull Trend

If we plot the trend using $3440 as the top of this trend, a lot of historic support and resistance levels start to make a lot more sense within the context of the market. Our move to the $1800s marked a test of the 50% retracement line, our battle over the $2600s marked the various tests of the 23.6% retracement line and now our ultimate sudden rush to new highs can be seen as the 100% retracement line.

Keeping the same Fibonacci Retracement Lines and zooming into our daily trend, a few observations immediately pop out:

Figure_2 (3).JPGFigure 2: BTC-USD, 1 Day Candles, Bitfinex, Macro Bull Trend, Zoomed In

  1. There is an obvious price increase on the long-term trend;

  2. Our recent run from $1800, however, has seen decreasing volume on every leg up;

  3. The multi-period MACD and current MACD histogram both show Bearish Divergence; and

  4. The RSI is showing Bearish Divergence.

If we take a closer look to the market post-$1800s, we see a similar trend of divergence even on the smaller timescales:

Figure_3 (4).JPGFigure 3: BTC-USD, 6 Hour Candles, Bitfinex, Current ATH

  1. The uptrend in price is, once again, accompanied on decreasing volume;

  2. The 6HR is strongly diverging bearishly;

  3. The RSI is showing strong bearish divergence; and

  4. The 6HR Bollinger Bands show several candles fully formed outside the upper band (shown in the circle).

For those who are unfamiliar with Bollinger Bands: Simply put, they are a strong tool used to visualize market volatility. Typically, when a market is near the edge of the upper band, it is considered “overbought,” and when it nears the edge of the lower band it is considered “oversold.” When a market punctures a band it will typically yield a pullback to a trend within the bands, and when a candle is completely formed outside the bands it is usually a strong sell or buy signal — a sell signal in our case. You can think of the Bollinger Bands like a set of rubber bands: the tighter you stretch a rubber band, the harder the reaction. Typically, this is the case for markets that puncture the bands and especially for those that fully form candles outside the bands.

Looking at our current Bollinger Band trend, one might be tempted to say, “BTC-USD appears to be pulling back within the 6-Hour Bands — looks like a healthy move upward is still in the cards.” However, if we zoom out and look back through the history of BTC-USD and its interaction with the 1-Day Bollinger Bands, we can see a clear market trend.

Figure_4.JPGFigure 4: BTC-USD, 1 Day Candles, Bitfinex, Bollinger Band Trend

Above are several historic examples of BTC-USDs reaction to a puncturing of the 1-Day Bollinger Bands. More often than not, a puncturing of the bands — whether the lower or upper band — is greeted with a market pullback. The stronger the break of the bands, the stronger the pullback. The strongest breaks of the bands have a very strong tendency to return to the middle line of the Bollinger Bands (the dashed line) before continuing its trend up or down.

If there is so much damning evidence of a pullback, why does the price keep rising? Fear of Missing Out (FOMO) is unpredictable and irrational. FOMO can push markets well beyond what Technical Analysis can predict and often defies market indicator signals. With all the hype surrounding the recent hard fork, and the influx of money coming from people cashing out their bitcoin Cash where does this leave us? There is a mountain of evidence suggesting this market level is unhealthy and highly overextended; it needs either to consolidate considerably or retrace. BTC-USD is tightly wound and there is very little, if any, sign of health within its most recent market moves.

I’m not saying the market won’t continue to the pump even higher than it is currently — Goldman Sachs has a price target of $3600, after all. However, with each hike in the BTC-USD price, we are increasing the likelihood of a strong pullback and ultimately a return to the center of the Bollinger Bands.

Summary:

  1. On all relevant timescales, BTC-USD is showing strong signs of an overextended market.

  2. The Bollinger Bands have several candles fully formed outside the upper bands on the 6 HR, 12 HR and 1 Day Candles.

  3. Historically, when the 1 Day Bollinger Bands are punctured, there is a market pullback.

Trading and investing in digital assets like bitcoin, bitcoin cash and ether is highly speculative and comes with many risks. This analysis is for informational purposes and should not be considered investment advice. Statements and financial information on bitcoin Magazine and BTC Media related sites do not necessarily reflect the opinion of BTC Media and should not be construed as an endorsement or recommendation to buy, sell or hold. Past performance is not necessarily indicative of future results.

The post Bitcoin Price Analysis: Post-Fork Exuberance Shows No Signs of Pulling Back (Yet) appeared first on Bitcoin Magazine.